Images, Maps, Spectra and SEDs


0.073
00 37 49.18
-01 09 08.2
WLRG
FRII
3C15
PKS0034-01
Spitzer IRS spectra
Dicken et al. 2012
Spitzer IRS spectra
PKS0034-01
(Top left) 5GHz map
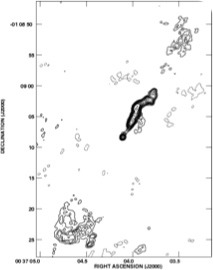
(Top right) Image of 0034-01 at 6-cm (VLA data). The contour levels are: , 1, 2, 3, 4, 6, 8, 10, 12, 14, 16, 20, 25, 30, 40, 50, 75, 100 mJy beam-1. The peak flux is 31.1 mJy beam-1.
Zoom-in of the jet (Bottom Right) and of the southern lobe (Botom Left) of 0034-01 at 6-cm. with superimposed vectors indicating the projected electric field direction. The vectors are proportional in length to the fractional polarisation (1 arcsec = 1.0 ratio). The contour levels are: , 1, 2, 4, 8, 16, 32, 64, 128 mJy beam-1

PKS0034-01
Spitzer MIPS infrared photometric observations. Left to right: 24 microns, 70 microns and 160 microns (when available). FOV are 5x5 arcmins for 24 microns, 5x2.5 arcmins for 70 microns and 0.5x5 arcmins for 160 microns.


Available Data Downloads
Infrared
Radio/Sub-mm
Optical
X-Ray

Chandra


Notes
This WLRG has a radio morphology that is intermediate between FRI and FRII classes, although its radio luminosity is typical of class II galaxies (Morganti et al. 1993). The source is resolved into a prominent one-sided jet, while only some structure is detected in the two lobes (due to the relatively high resolution). Knots are detected along the jet. The southern lobe is the brighter one but only shows a "warmer'' spot (as perhaps expected looking at the low resolution image in Morganti et al. 1993).
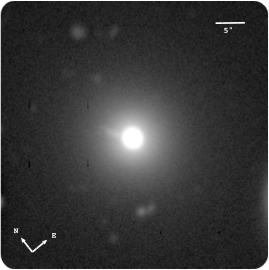
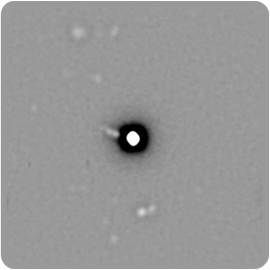
The Gemini optical image reveals the optical synchrotron jet reported for the first time in Martel et al. (1998). It extends to a projected distance of 7.5 kpc (∼40 arcsec) in the NW direction. The jet is also detected in the K-band images presented in Inskip et al. (2010). WFPC2/HST images of this source reveal subarcsecond-scale features including a dust lane and three emission filaments or arms (Martel et al. 1998; Sparks et al. 2000).
Weak [OIII]λ7007 is detected in PKS0034-01 optical spectrum. The optical spectral continuum shows absorption features typical of early-type galaxies.
From the extrapolation of the high frequency radio core component towards the infrared region of the spectral energy distribution, Dicken et al. (2008) finds evidence that the non-thermal core synchrotron emission may contaminate the MFIR flux in this radio galaxy (see also van der Wolk et al. 2010, A&A, 511, 64).

Gemini/GMOS-S: Unsharp mask image
6cm VLA radio map


PKS0034-01
Spectral energy distribution. The blue solid line is fitted to the data from 109 to 1010 Hz. Extrapolating this line from the radio to the infrared SED tests whether non-thermal synchrotron emission from the lobes can contaminate the Spitzer mid-infrared flux. In this case the lobes emission lies out of the Spitzer beam so cannot contaminate the Spitzer data. However, extrapolating the, flat spectrum, radio core SED into the infrared, shows that the core synchrotron emission could be a possible source of non-thermal contamination to the thermal infrared flux.


Far -Infrared
Herschel PACS
APEX LABOCA


E
N
