


Other name:
Redshift:
RA (j2000):
Dec (j2000):
Optical class:
Radio Class:
0.188
00 40 50.53
+10 03 26.8
BLRG
FRII
3C18

Notes
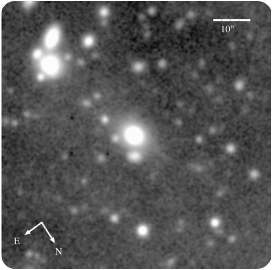
This BLRG/FRII is found to have about two-thirds of its near-infrared K-band flux in an unresolved nuclear component (Inskip et al. 2010). The galaxy appears to be in a dense environment, with several companions within ∼20 arcsec. Our Gemini GMOS-S image reveals a faint and long tidal tail of surface brightness μV = 26.2 mag arcsec−2 extending up to 40 kpc to the NW — this is the faintest tidal feature detected in our imaging survey (Ramos Almeida et al. 2011a). In the K-band images shown in Inskip et al. (2010), the galaxy appears elongated in the direction of the tidal tail. However, due to the faintness of the latter feature, it is not clearly detected in the near-IR. Our long-slit spectrum of the galaxy does not allow us to confirm/discard the emission-line nature of this tail.
PKS 0038+09 has a rich emission-line spectrum, with an extremely high ionization state, a strong broad Hα component, and hints of broad wings to the Hα line. There are no clear detections of stellar absorption features. The emission lies may be slightly extended. Direct AGN light is likely to contribute much of the UV excess in this BLRG, which has a low UV polarization (Tadhunter et al. 2002).
From the extrapolation of the high frequency radio core component towards the infrared region of the spectral energy distribution, Dicken et al. (2008) find evidence that the non-thermal core synchrotron emission may contaminate the MFIR flux in this radio galaxy.
Gemini/GMOS-S: median filtered image
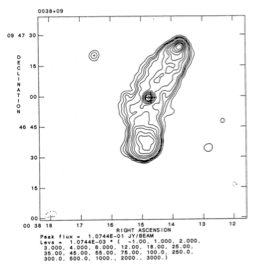
5Ghz VLA radio map


Flux data
Available Data Downloads
Images, Maps, Spectra and SEDs
Infrared data
Radio data
Optical data
X-Ray data

Chandra


Spitzer IRS spectra
PKS0038+09
Spitzer IRS spectra
Dicken et al. (in preperation)

PKS0038+09
Spitzer MIPS infrared photometric observations. Left to right: 24 microns, 70 microns and 160 microns (when available). FOV are 5x5 arcmins for 24 microns, 5x2.5 arcmins for 70 microns and 0.5x5 arcmins for 160 microns.

![Wavelength/
Frequency Flux Units Reference
5GHz 1.6 Jy Morganti et al. (1993)
[OIII] -13.99 Log erg/cm2/s Tadhunter et al. (1993)
15GHz core 55.6 mJy Dicken et al. (2008)
22 GHz core 68.6 mJy Dicken et al. (2008)
24 microns 25.9 mJy Dicken et al. (2008)
70 microns 32.3 mJy Dicken et al. (2008)
160 microns <37.8 mJy Dicken et al. (2008)
X-ray - - -](PKS0038+09_files/shapeimage_21.png)


N

E
PKS0038+09
Spectral energy distribution. The blue solid line is fitted to the data from 109 to 1010 Hz. Extrapolating this line from the radio to the infrared SED tests whether non-thermal synchrotron emission from the lobes can contaminate the Spitzer mid-infrared flux. In this case the lobes emission lies out of the Spitzer beam so cannot contaminate the Spitzer data. However, extrapolating the, flat spectrum, radio core SED into the infrared, shows that the core synchrotron emission could be a possible source of non-thermal contamination to the thermal infrared flux.