


Other name:
Redshift:
RA (j2000):
Dec (j2000):
Optical class:
Radio Class:
0.116
00 46 17.75
-42 07 51.4
WLRG
FRII
-


Flux data
Available Data Downloads
Images, Maps, Spectra and SEDs
Infrared data
Radio data
Optical data
X-Ray data


Chandra


Spitzer IRS spectra
PKS0043-42
(Top) Image of 0043-42 at 6-cm (full resolution). The contour levels are: , 1, 1.5, 2, 3, 4, 6, 8, 16, 32, 64, 128 mJy beam-1 The peak flux is 291.0 mJy beam-1. The two inserts show the images of the hot-spots at 3 cm (full resolution). The contour levels are: , 1, 2, 3, 4, 6, 8, 10,12, 16, 32, 64, 128, 256 mJy beam-1 for the southern hot-spot and , 1, 2, 3, 4, 8, 12, 16, 20, 24, 30, 40, 50, 60, 80, 100, 150, 175, 200, 225 mJy beam-1 for the northern one. The peak flux is 155.0 mJy beam-1. (Bottom) Image of 0043-42 at 6-cm (low resolution) with superimposed vectors indicating the projected electric field direction. The vectors are proportional in length to the fractional polarisation (1 arcsec = 0.14 ratio). The contour levels are: , 1, 2, 3, 4, 6, 8, 16, 32, 64, 128, 256 mJy beam-1. The peak flux is 545.8 mJy beam-1. The cross indicates the position (from di Serego et al. 1994) of the optical galaxy
PKS0043-42
Spitzer IRS spectra
Dicken et al. (in preperation)

PKS0043-42
Spitzer MIPS infrared photometric observations. Left to right: 24 microns, 70 microns and 160 microns (when available). FOV are 5x5 arcmins for 24 microns, 5x2.5 arcmins for 70 microns and 0.5x5 arcmins for 160 microns.

![Wavelength/
Frequency Flux Units Reference
5GHz 2.98 Jy Morganti et al. (1993)
[OIII] -14.85 Log erg/cm2/s Tadhunter et al. (1993)
15GHz core 1.4 mJy Dicken et al. (2008)
22 GHz core - mJy Dicken et al. (2008)
24 microns 11.1 mJy Dicken et al. (2008)
70 microns 9.9 mJy Dicken et al. (2008)
160 microns <24.9 mJy Dicken et al. (2008)
X-ray - - -](PKS0043-42_files/shapeimage_20.png)


N

E

Notes
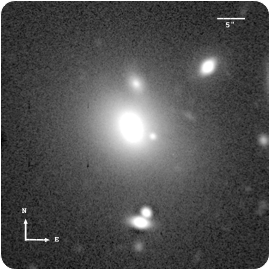
PKS 0043−42 is a weak-line radio galaxy, which appears as a relatively undisturbed elliptical galaxy at optical wavelengths (Ramos Almeida et al. 2011a), although there are hints from the analysis of near-IR images that it is interacting with a smaller companion galaxy to the north (Inskip et al. 2010). Three further objects lie to the south and north east at projected distances of ∼17 arcsec. In the near-infrared the inner regions of this galaxy are complex, where an a central isophotal twist is observed and an E–W dimming/N–S excess flux, possibly due to a dust lane and/or excess flux associated with the apparent interaction.
This is a very extended radio source with a typical FRII morphology. At 3-cm most of the extended emission is resolved out at the resolution of our data. Thus, only the hot-spots could be imaged at this frequency. At 6 cm no radio core has been detected. The polarization is very uniform in the lobes, with the electric field well aligned with the position of the radio axis (Morganti et al. 1999).
Weak [OII]λ3727 and [OIII]λ5007 emission lines are detected in the optical spectrum. The continuum spectrum is typical of early-type galaxies. Thus, this is an FRII (and powerful) radio galaxies with significantly weaker emission lines that expected from the radio power-emission line luminosity correlation. However, despite the weak emission lines, analysis of our deep Spitzer IRS spectrum shows clear evidence for thermal dust emission associated with a circum-nuclear torus (Ramos Almeida et al. 2011).
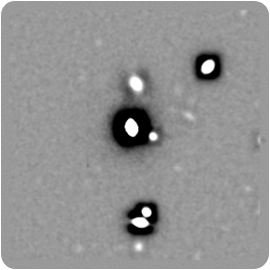
Gemini/GMOS-S: Unsharp mask image
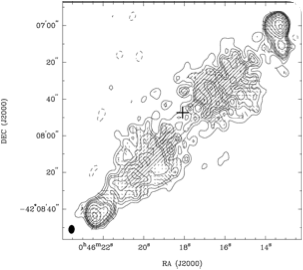

6cm ATCA radio map
PKS0043-42
Spectral energy distribution. The blue solid line is fitted to the data from 109 to 1010 Hz. Extrapolating this line from the radio to the infrared SED tests whether non-thermal synchrotron emission from the lobes can contaminate the Spitzer mid-infrared flux. In this case the lobes emission lies out of the Spitzer beam so cannot contaminate the Spitzer data. The weak, flat spectrum, non-thermal radio core emission is also not likely to contaminate the Spitzer infrared flux data for this object.