

Flux data
Available Data Downloads
Images, Maps, Spectra and SEDs


Infrared data
Radio data
Optical data
X-Ray data


Spitzer IRS spectra

PKS0105-16
Spitzer IRS spectra
Dicken et al. (in preperation)


PKS0105-16
Spitzer MIPS infrared photometric observations. Left to right: 24 microns, 70 microns and 160 microns (when available). FOV are 5x5 arcmins for 24 microns, 5x2.5 arcmins for 70 microns and 0.5x5 arcmins for 160 microns.


![Wavelength/
Frequency Flux Units Reference
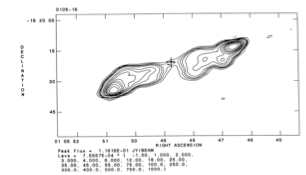
5GHz 1.17 Jy Morganti et al. (1993)
[OIII] -14.37 Log erg/cm2/s Tadhunter et al. (1993) 15GHz core <1.1 mJy Dicken et al. (2008)
22 GHz core <2.3 mJy Dicken et al. (2008)
24 microns 9.7 mJy Dicken et al. (2008)
70 microns <11.8 mJy Dicken et al. (2008)
160 microns <22.5 mJy Dicken et al. (2008)
X-ray - - -](PKS0105-16_files/shapeimage_19.png)


Other name:
Redshift:
RA (j2000):
Dec (j2000):
Optical class:
Radio Class:
0.400
01 08 16.9
-16 04 20.6
NLRG
FRII
3C32

N

E


Notes
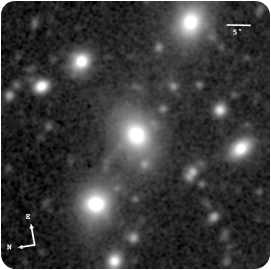
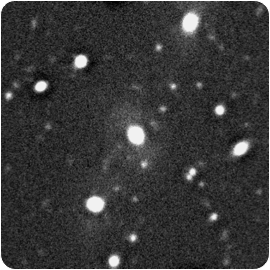
Gemini optical imaging of this NLRG/FRII galaxy reveals a bridge of μ_V = 24.6 mag arcsec−2 that appears to link the radio galaxy host with an early-type galaxy of similar brightness ∼70 kpc NW. Emission-line contamination of the detected feature cannot be ruled out based on the existing long-slit spectra (Ramos Almeida et al. 2011a).
This FR II radio galaxy has a modest UV excess, no significant UV polarization, and no clear detection of broad permitted lines. The origin of its UV excess is not clear (Tadhunter et al. 2002).

Gemini/GMOS-S: median filtered image

5 GHz VLA radio map
XMM
PKS0105-16
Spectral energy distribution. The blue solid line is fitted to the data from 109 to 1010 Hz. Extrapolating this line from the radio to the infrared SED tests whether non-thermal synchrotron emission from the lobes can contaminate the Spitzer mid-infrared flux. In this case the lobes emission lies out of the Spitzer beam so cannot contaminate the Spitzer data. The weak, flat spectrum, non-thermal radio core emission is also not likely to contaminate the Spitzer infrared flux data for this object.