

Flux data
Available Data Downloads
Images, Maps, Spectra and SEDs


Infrared data
Radio data
Optical data


Spitzer IRS spectra
PKS0117-15
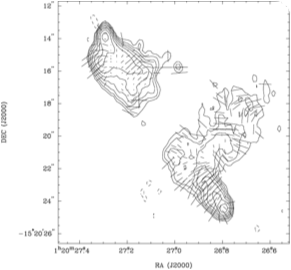
(Top) 5Ghz
(Bottom) Image of 0117-15 at 6-cm with superimposed vectors indicating the projected electric field direction. The vectors are proportional in length to the fractional polarisation (1 arcsec = 0.081 ratio). The contour levels are: , 1, 2, 4, 8, 16, 32, 64, 128 mJy beam-1. The peak flux is 97.0 mJy beam-1. The cross indicates the position (from di Serego et al. 1994) of the optical galaxy

PKS0117-15
Spitzer IRS spectra
Dicken et al. (in preperation)

PKS0117-15
Spitzer MIPS infrared photometric observations. Left to right: 24 microns, 70 microns and 160 microns (when available). FOV are 5x5 arcmins for 24 microns, 5x2.5 arcmins for 70 microns and 0.5x5 arcmins for 160 microns.


![Wavelength/
Frequency Flux Units Reference
5GHz 1.6 Jy Morganti et al. (1993)
[OIII] -13.92 Log erg/cm2/s Tadhunter et al. (1993) 15GHz core <2.4 mJy Dicken et al. (2008)
22 GHz core <2.8 mJy Dicken et al. (2008)
24 microns 6.1 mJy Dicken et al. (2008)
70 microns 20.2 mJy Dicken et al. (2008)
160 microns 46.4 mJy Dicken et al. (2008)
X-ray - - -](PKS0117-15_files/shapeimage_18.png)


Other name:
Redshift:
RA (j2000):
Dec (j2000):
Optical class:
Radio Class:
0.565
01 20 27.16
-15 20 17.8
NLRG
FRII
3C38


Notes
This is a double lobed radio galaxy with a typical FRII structure. No core has been detected. Both lobes have clear hot spots, and the southern lobe shows a clear bend in a direction almost perpendicular to the line connecting the two lobes. Similar structure detected, e.g., in 3C 326 (Ekers et al. 1978) has been explained as result of a precessing beam. An alternative explanation has been suggested from a systematic study of bridges in double radio sources by Leahy & Williams (1984). The sharp distortion often observed in these sources can be expected as consequence of the interaction between the strong back-flow and the galactic atmosphere, if the jet is much lighter than the confining medium (Morganti et al. 2002). The radio lobe on the same side as the extended emission lines is closer to the nucleus and has the lower fractional polarization. This may indicate a higher depolarization but confirmation will require observations at different frequencies.
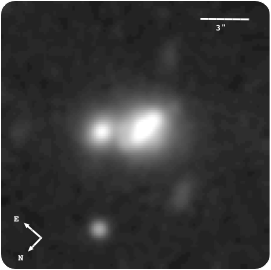
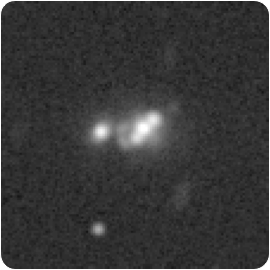
The Gemini optical image of this NLRG/FRII, taken in excellent seeing conditions (FWHM = 0.5 arcsec), shows a high-surface-brightness triple nucleus system of ∼9 kpc diameter co-aligned along PA = 8◦ (Ramos Almeida et al. 2011a, Fig. B42). In addition, a shell is detected on the western side of the radio galaxy extending up to 21 kpc, for which we measure a surface brightness of μ_V = 25.1 mag arcsec−2 , as well as an arc-like structure of μ_V = 21.3 mag arcsec−2, and a companion galaxy ∼9 and ∼17 kpc to the NE of the central nucleus, respectively. Interestingly, the NE arc shows a gap close to its interception with the axis of the large-scale radio structure (PA = 35 degrees). This suggests a possible interaction between the arc and the radio jet. However, although the central triple structure shows some resemblance with the structures found closely aligned with the radio axes of some high-redshift radio galaxies (e.g. McCarthy et al. 1987; Best, Longair & Rottgering 1996) it is, in fact, significantly misaligned from the radio axis by 27 degrees. Therefore, it is uncertain whether the latter structure is due to jet/cloud interactions. Dust features between the triple system components are tentatively detected in our processed images. The results on the degree of emission-line contamination of the detected features are inconclusive, based on our existing long-slit spectra. Clearly, further optical spectroscopic and NIR imaging observations are required to determine whether the central triple structure is stellar in nature, or represents a manifestation of the “alignment effect” frequently observed in high-redshift radio galaxies.
The optical spectrum of this galaxy reveals a high ionization spectrum, with both the continuum and the line emission extended in the north-east direction. The continuum shows a strong UV/blue excess and substantial optical polarisation (Tadhunter et al. 2002). This high-redshift FR II radio galaxy is one of the most highly polarized objects in the 2Jy sample at optical/UV wavelengths. Given the high intrinsic polarization (Tadhunter et al. 2002), it is likely that scattered AGN light dominates the UV excess in this source.


Gemini/GMOS-S: median filtered image

6 cm VLA radio map
PKS0117-15
Spectral energy distribution. The blue solid line is fitted to the data from 109 to 1010 Hz. Extrapolating this line from the radio to the infrared SED tests whether non-thermal synchrotron emission from the lobes can contaminate the Spitzer mid-infrared flux. In this case the lobes emission lies out of the Spitzer beam so cannot contaminate the Spitzer data. The weak, flat spectrum, non-thermal radio core emission is also not likely to contaminate the Spitzer infrared flux data for this object.