


Flux data
Available Data Downloads
Images, Maps, Spectra and SEDs


Infrared data
Radio data
Optical data
X-Ray data


Spitzer IRS spectra

PKS0235-19
Spitzer IRS spectra
Dicken et al. (in preperation)

PKS0235-19
Spitzer MIPS infrared photometric observations. Left to right: 24 microns, 70 microns and 160 microns (when available). FOV are 5x5 arcmins for 24 microns, 5x2.5 arcmins for 70 microns and 0.5x5 arcmins for 160 microns.


![Wavelength/
Frequency Flux Units Reference
5GHz 1.44 Jy Morganti et al. (1993)
[OIII] -13.68 Log erg/cm2/s Tadhunter et al. (1993) 15GHz core <1.7 mJy Dicken et al. (2008)
22 GHz core <2.8 mJy Dicken et al. (2008)
24 microns 11.1 mJy Dicken et al. (2008)
70 microns 14.3 mJy Dicken et al. (2008)
160 microns <23.6 mJy Dicken et al. (2008)
X-ray - - -](PKS0235-19_files/shapeimage_19.png)


Other name:
Redshift:
RA (j2000):
Dec (j2000):
Optical class:
Radio Class:
0.620
02 37 43.45
-19 32 33.3
BLRG
FRII
OD-159


Notes
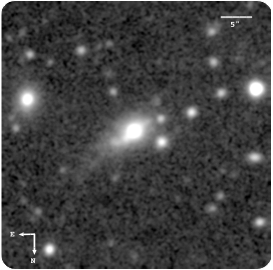
This source is variable at low radio frequencies (Mantovani et al. 1992). Gemini optical imaging of this BLRG/FRII shows tidal tails of similar surface brightness to both the NE and SW of the nucleus along PA = 52 degrees, with a maximum extent of ∼15 kpc to the NE (μ_V = 22.2 and 22.4 mag arcsec−2 for the NE and SW tails, respectively: Ramos Almeida et al. 2011a). Apart from the tidal tails, another interpretation of the observed structures is that they represent a warped disc structure with the BLRG nucleus at its centre. The tail/disc structure is significantly misaligned by 42 degrees from the axis of the large-scale radio structure (PA = 94 degrees). Although we do not consider it for the morphological classification of the galaxy, there is tentative evidence for a bridge linking the radio galaxy with the smaller galaxy 165 kpc to the NE. The bridge appears as an elongation of the NE tidal tail, but much fainter. Our long-slit spectra of this galaxy suggest that line contamination may be a serious issue for the tail/disc structure.
The optical spectrum shows rich high-ionization emission lines and a large UV excess, but has a low UV polarization (Tadhunter et al. 2002). Weak broad wings are marginally detected to the Hβ and MgII 2800 permitted lines. Although deeper spectroscopic observations are required to confirm that this is a BLRG in which the UV excess is dominated by direct AGN light, the detection of a strong silicate emission feature in the Spitzer IRS spectrum for this source supports a BLRG classification (Dicken et al. 2011).
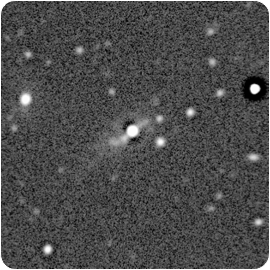
Gemini/GMOS-S: median filtered image
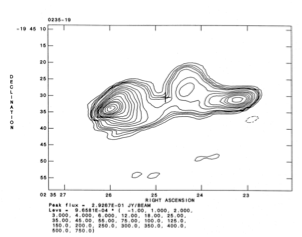
5 GHz VLA radio map
XMM
PKS0235-19
Spectral energy distribution. The blue solid line is fitted to the data from 109 to 1010 Hz. Extrapolating this line from the radio to the infrared SED tests whether non-thermal synchrotron emission from the lobes can contaminate the Spitzer mid-infrared flux. In this case the lobes emission lies out of the Spitzer beam so cannot contaminate the Spitzer data. The weak, flat spectrum, non-thermal radio core emission is also not likely to contaminate the Spitzer infrared flux data for this object.