


Flux data
Available Data Downloads


Infrared data
Radio data
Optical data
X-Ray data


Chandra

Spitzer IRS spectra

PKS0349-27
Spitzer IRS spectra
Dicken et al. (in preperation)

PKS0349-27
Spitzer MIPS infrared photometric observations. Left to right: 24 microns, 70 microns and 160 microns (when available). FOV are 5x5 arcmins for 24 microns, 5x2.5 arcmins for 70 microns and 0.5x5 arcmins for 160 microns.


![Wavelength/
Frequency Flux Units Reference
5GHz 2.04 Jy Morganti et al. (1993)
[OIII] λ5007 -13.95 Log erg/cm2/s Tadhunter et al. (1993) 15GHz core 17.5 mJy Dicken et al. (2008)
22 GHz core 17.4 mJy Dicken et al. (2008)
24 microns 8.8 mJy Dicken et al. (2008)
70 microns 41.9 mJy Dicken et al. (2008)
160 microns 31.3 mJy Dicken et al. (2008)
X-ray - - -](PKS0349-27_files/shapeimage_18.png)


Other name:
Redshift:
RA (j2000):
Dec (j2000):
Optical class:
Radio Class:
0.066
03 51 35.81
-27 44 33.8
NLRG
FRII
-


N

E


Notes
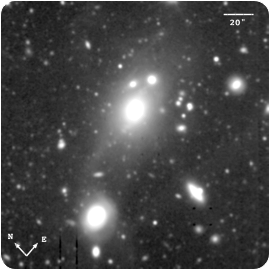
This is a well-known FRII radio galaxy (Danziger et al. 1984) that shows a spectacular morphology in optical Gemini/GMOS-S imaging (Ramos Almeida et al. 2011a). This galaxy was studied by Heckman et al. (1986), who analysed narrow-band [O III] λ5007 and broad V-band images. They reported the existence of two close companion galaxies 26 and 20 kpc to the east and NE of the nucleus, respectively. In their images (both narrow- and broad-band) they detected a bridge linking the radio galaxy with the eastern companion located at 26 kpc and a tail-like structure pointing to the opposite direction and extending up to 20 kpc. According to the study of the gas kinematics of this system presented by Danziger et al. (1984), these features are very likely the result of an interaction with the eastern galaxy companion. Our deep GMOS-S image shows the scenario of this interaction in much more detail. We confirm the existence of the structures detected by Heckman et al. (1986), and measure a surface brightness for the bridge linking the radio galaxy with the eastern companion of μ_V =25.5 mag arcsec^−2. In addition, we also detect a more extended, and fainter, bridge linking the radio galaxy with the clearly distorted galaxy at 83 kpc to the west (μ_V =26.5 mag arcsec^−2). The latter bridge feature was also detected by Hansen, Jorgensen & Norgaard-Nielsen (1987) in their deep Hα+[NII] image, at a surface brightness level which suggests that much of the emission from the bridge detected in our GMOS-S image could be emission line, rather than continuum radiation. Whereas Hansen et al. (1987) classified the distorted galaxy at the end of the larger bridge as an elliptical, it is clearly revealed as a disc galaxy in our GMOS-S image. The median-filtered image also reveals the presence of a faint shell extending ∼10 kpc to the west of the radio galaxy nucleus.
Details of the optical spectrum of this object are presented in Danziger et al. (1984).
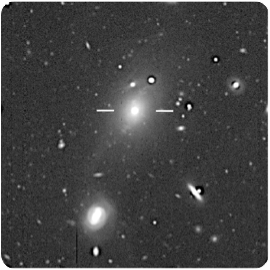
Gemini/GMOS-S: Unsharp mask image
Images, Maps, Spectra and SEDs
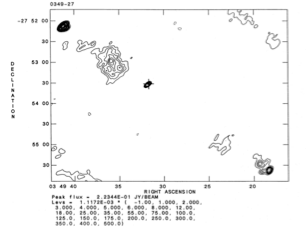
5 GHz VLA radio map
PKS0349-27
Spectral energy distribution. The blue solid line is fitted to the data from 109 to 1010 Hz. Extrapolating this line from the radio to the infrared SED tests whether non-thermal synchrotron emission from the lobes can contaminate the Spitzer mid-infrared flux. In this case the lobes emission lies out of the Spitzer beam so cannot contaminate the Spitzer data. The weak, flat spectrum, non-thermal radio core emission is also not likely to contaminate the Spitzer infrared flux data for this object.