


Flux data
Available Data Downloads
Images, Maps, Spectra and SEDs


Infrared data
Radio data
Optical data
X-Ray data


Spitzer IRS spectra
PKS0409-75
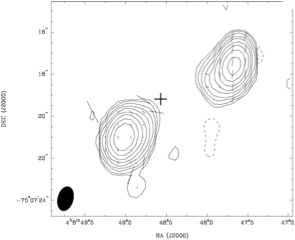
(Top) Image of 0409-75 at 3-cm (full resolution) with superimposed vectors indicating the projected electric field direction. The vectors are proportional in length to the fractional polarisation (1 arcsec = 0.22 ratio). The contour levels are: , 1, 2, 4, 8, 16, 32, 64, 128, 256 mJy beam-1. The peak flux is 1.255 Jy beam-1. The cross indicates the position (from di Serego et al. 1994) of the optical galaxy. (Bottom) Image of 0409-75 at 6-cm with superimposed vectors indicating the projected electric field direction. The vectors are proportional in length to the fractional polarisation (1 arcsec = 0.15 ratio). The contour levels are: , 1, 2, 4, 8, 16, 32, 64, 128, 256 mJy beam-1. The peak flux is 2.349 Jy beam-1


PKS0409-75
Spitzer MIPS infrared photometric observations. Left to right: 24 microns, 70 microns and 160 microns (when available). FOV are 5x5 arcmins for 24 microns, 5x2.5 arcmins for 70 microns and 0.5x5 arcmins for 160 microns.


![Wavelength/
Frequency Flux Units Reference
5GHz 4.25 Jy Morganti et al. (1993)
[OIII] λ5007 -13.99 Log erg/cm2/s Tadhunter et al. (1993) 15GHz core <10 mJy Dicken et al. (2008)
22 GHz core <9 mJy Dicken et al. (2008)
24 microns 1.5 mJy Dicken et al. (2008)
70 microns 11.2 mJy Dicken et al. (2008)
160 microns <36.4 mJy Dicken et al. (2008)
X-ray - - -](PKS0409-75_files/shapeimage_19.png)


Other name:
Redshift:
RA (j2000):
Dec (j2000):
Optical class:
Radio Class:
0.693
04 08 48.49
-75 07 19.3
NLRG
FRII
-


Notes
A NLRG/FRII at z = 0.693, PKS 0409−75 is both the most distant radio source in the 2Jy sample and the most powerful at radio wavelengths. Indeed, it is one of the most powerful intermediate-redshift radio sources in the southern hemisphere (S4.8 GHz = Log 28.17 W/Hz ; Morganti et al. 1993). The FR II radio source is relatively small (largest angular size, LAS = 9 arcsec or 85 kpc) and is dominated by two lobes of emission extending along PA130 (Morganti et al. 1999). PKS 0409−75 is optically identified with a m_V = 21.6 galaxy which is resolved into two components and displays extended emission in [OII]λ3727 (di Serego Alighieri et al. 1994).
The low-resolution optical spectrum of PKS 0409−75 reveals a significant UV excess compared with passively evolving elliptical galaxies at similar redshifts (Tadhunter et al. 2002, Holt et al. 2007). The narrow emission-line luminosity and ionization state are relatively low for the radio power – in the optical spectrum the [OII]λ3727, [NeV]λ3426, [NeIII]λ3869, H and [OIII]λ5007 emission lines have been detected, however, the [O III] is barely detected whilst [O II] is relatively strong in the spectrum presented by Tadhunter et al. (1993). Tadhunter et al. (2002) attempted to model the optical/UV continuum but were unable to obtain a result due to poor sky subtraction. They do report a measurement of the 4000 Å break which suggests 95% of the light in the 3750–3950 Å region is not emitted by the old stellar population.
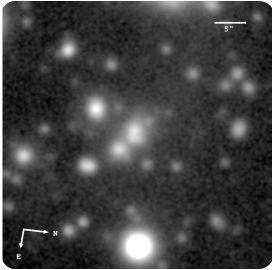
Spectral synthesis modelling of a deep VLT optical spectrum of the integrated light of the host galaxy by Holt et al. (2007) demonstrates that a contribution from a stellar component of relatively young (<0.05 Gyr) age is required to model its SED accurately. Our GMOS-S i′-band image reveals a secondary nucleus of similar brightness to the radio galaxy ∼8 kpc to the east along PA = 84 degrees. Note that the axis of the double nucleus is misaligned by ∼40◦ from the axis of the large-scale radio structure (PA = 124 degrees). The double nucleus system lies in a crowded field, and there are a number of galaxies of similar brightness within 150 kpc. Although the system looks disturbed, unfortunately the high value of the seeing measured for this image (FWHM = 1.15 arcsec) prevents any more detailed morphological classification. The continuum or line-emitting nature of the secondary nucleus is uncertain based on long-slit spectra of this source.
Further evidence for recent star formation activity is provided by Spitzer observations which demonstrate that it has a high 70-μm luminosity for its (relatively modest) emission-line luminosity (Dicken et al. 2009), as well as cool MFIR colours. However, there is a possibility that the non-thermal synchrotron radio lobe emission may contaminate the MFIR flux in this radio galaxy, because the lobes lie within the Spitzer beam (Dicken et al. 2008).
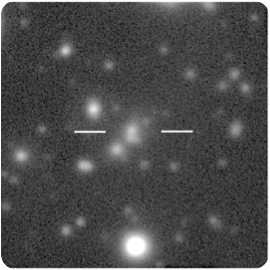
Gemini/GMOS-S: median filtered image
3 cm ATCA radio map
XMM
PKS0409-75
Spectral energy distribution. The blue solid line is fitted to the data from 109 to 1010 Hz. Extrapolating this line from the radio to the infrared SED tests whether non-thermal synchrotron emission from the lobes can contaminate the Spitzer mid-infrared flux. In this case the lobes emission lies inside the Spitzer beam so non-thermal contamination is a possibility for the Spitzer data. However, the weak, flat spectrum, non-thermal radio core emission is not likely to contaminate the Spitzer infrared flux data for this object.
PKS0409-75
Spitzer IRS spectra
Dicken et al. (in preperation)