

Flux data
Available Data Downloads
Images, Maps, Spectra and SEDs


Infrared data
Radio data
Optical data
X-Ray data


Chandra

ESO Optical spectra
Spitzer IRS spectra
PKS0442-28
(Top) 5GHz
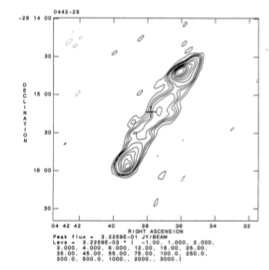
(Middle) Image of 0442-28 at 6-cm. The contour levels are: , 1, 2, 3, 4, 6, 8, 10, 15, 20, 25, 30, 50, 100, 200, 400 mJy beam-1. The peak flux is 197.0 mJy beam-1. (Bottom) Zoom-in of the southern (Right) and of the northern lobe (Left) of 0442-28 at 6-cm. with superimposed vectors indicating the projected electric field direction. The vectors are proportional in length to the fractional polarisation (1 arcsec = 1.0 ratio). The contour levels are: , 1, 2, 4, 8, 10, 15, 20, 25, 30, 40, 50 mJy beam-1

PKS0442-28
Spitzer IRS spectra
Dicken et al. (in preperation)


PKS0442-28
Spitzer MIPS infrared photometric observations. Left to right: 24 microns, 70 microns and 160 microns (when available). FOV are 5x5 arcmins for 24 microns, 5x2.5 arcmins for 70 microns and 0.5x5 arcmins for 160 microns.


![Wavelength/
Frequency Flux Units Reference
5GHz 2.21 Jy Morganti et al. (1993)
[OIII] λ5007 -13.96 Log erg/cm2/s Tadhunter et al. (1993)
15GHz core 19.1 mJy Dicken et al. (2008)
22 GHz core 20.4 mJy Dicken et al. (2008)
24 microns 22.0 mJy Dicken et al. (2008)
70 microns 31.0 mJy Dicken et al. (2008)
160 microns <25.9 mJy Dicken et al. (2008)
X-ray - - -](PKS0442-28_files/shapeimage_18.png)


Other name:
Redshift:
RA (j2000):
Dec (j2000):
Optical class:
Radio Class:
0.147
04 44 37.67
-28 09 54.6
NLRG
FRII
OF-271


N

E


Notes
The radio observations for this NLRG/FRII galaxy (Morganti et al. 1999) shows a complex morphology for its radio lobes. A core has been detected but no radio jets.
This object has strong, narrow optical emission lines [O III] λλ5007, 4959 and [O II] λ3727 (Tadhunter et al. 1993). The optical continuum colours may be slightly bluer than those of typical early type-galaxies and there are no clear detections of stellar absorption features. It is also detected in X-rays (Siebert et al. 1996), where it appears to be extended, even though this source is not known to be associated with a cluster.
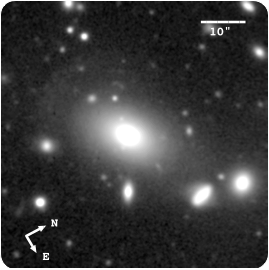
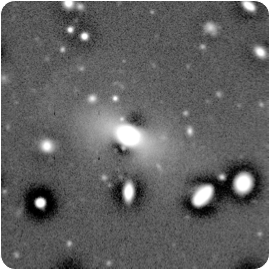
The optical image shows a faint, but sharply defined shell ∼50 kpc to SW of its nucleus in our GMOS-S image (Ramos Almeida et al. 2011a). This shell has a surface brightness μ_V = 25.7 mag arcsec^−2. There are several galaxies within ∼20 arcsec, any of them possibly interacting with the radio galaxy.

Gemini/GMOS-S: median filtered image

5 GHz VLA radio map
PKS0442-28
Spectral energy distribution. The blue solid line is fitted to the data from 109 to 1010 Hz. Extrapolating this line from the radio to the infrared SED tests whether non-thermal synchrotron emission from the lobes can contaminate the Spitzer mid-infrared flux. In this case the lobes emission lies out of the Spitzer beam so cannot contaminate the Spitzer data. The weak, flat spectrum, non-thermal radio core emission is also not likely to contaminate the Spitzer infrared flux data for this object.