

Flux data
Available Data Downloads


Infrared data
Radio data
Optical data
X-Ray data


Chandra


Spitzer IRS spectra

PKS0620-52
Spitzer IRS spectra
Dicken et al. (in preperation)


PKS0620-52
Spitzer MIPS infrared photometric observations. Left to right: 24 microns, 70 microns and 160 microns (when available). FOV are 5x5 arcmins for 24 microns, 5x2.5 arcmins for 70 microns and 0.5x5 arcmins for 160 microns.


![Wavelength/
Frequency Flux Units Reference
5GHz 1.25 Jy Morganti et al. (1993)
[OIII] λ5007 -13.99 Log erg/cm2/s Tadhunter et al. (1993)
15GHz core 118.6 mJy Dicken et al. (2008)
22 GHz core 101.2 mJy Dicken et al. (2008)
24 microns 4.5 mJy Dicken et al. (2008)
70 microns 47.3 mJy Dicken et al. (2008)
160 microns <24.3 mJy Dicken et al. (2008)
X-ray - - -](PKS0620-52_files/shapeimage_19.png)


Other name:
Redshift:
RA (j2000):
Dec (j2000):
Optical class:
Radio Class:

0.051
06 21 43.29
-52 41 33.3
WLRG
FRI
-
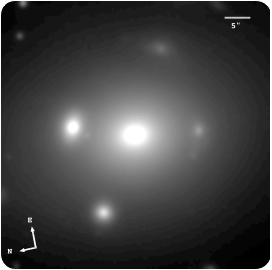
Gemini/GMOS-S: median filtered image

Notes
The deep r′ image for PKS0620-52 presented in Ramos Almeida et al. (2010a) suggests that this FRI radio galaxy is the dominant cD galaxy in a rich cluster, a conclusion supported by the presence of a moderately luminous X-ray halo (Siebert et al. 1996; Trussoni et al. 1999). However, in this case there is no clear evidence for morphological disturbance, apart from the high incidence of nearby companion galaxies that is expected at the centre of a galaxy cluster. Spectral synthesis modelling by Wills et al. (2004) shows clear evidence for a young stellar population, although the relatively narrow spectral coverage and low S/N of their spectra precluded the determination of an accurate age for the YSP. We have attempted to improve the determination of the properties of the YSP in this source by modelling a deeper, wider spectral coverage spectrum that was taken using the ESO 3.6-m telescope in 2007 (Tadhunter et al. 2011). We find that we can obtain good fits to both the continuum SED and the detailed absorption line features for YSP ages <0.9 Gyr and reddening in the range 0 < E(B − V) < 1.5mag; older YSP ages are ruled out because they over-predict the strengths of the Ca II H+K absorption line features. It is not possible to determine the ages and reddening of the YSP more accurately for PKS0620-52 with the existing data, since the YSP make a relatively small contribution to the optical continuum (10–25 per cent at 4720 A), although larger than in the case of Fornax A.
Based on the extrapolation of the high frequency radio core component towards the infrared region of the spectral energy distribution, it is possible that the non-thermal core synchrotron emission may contaminate the thermal infrared flux in this radio galaxy Dicken et al. 2008).

Images, Maps, Spectra and SEDs
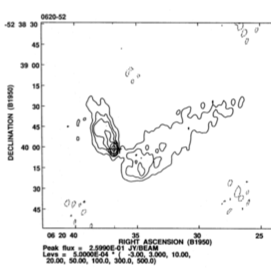
5 GHz ATCA radio map
ATCA 5GHz
PKS0620-52
Spectral energy distribution. The blue solid line is fitted to the data from 109 to 1010 Hz. Extrapolating this line from the radio to the infrared SED tests whether non-thermal synchrotron emission from the lobes can contaminate the Spitzer mid-infrared flux. In this case the lobes emission lies out of the Spitzer beam so cannot contaminate the Spitzer data. However, extrapolating the, flat spectrum, radio core SED into the infrared, shows that the core synchrotron emission could be a possible source of non-thermal contamination to the thermal infrared flux.