


Flux data
Available Data Downloads
Images, Maps, Spectra and SEDs


Infrared data
Radio data
Optical data
X-Ray data


Chandra

ESO Optical spectra
Spitzer IRS spectra

PKS0806-10
Spitzer IRS spectra
Dicken et al. (in preperation)

PKS0806-10
Spitzer MIPS infrared photometric observations. Left to right: 24 microns, 70 microns and 160 microns (when available). FOV are 5x5 arcmins for 24 microns, 5x2.5 arcmins for 70 microns and 0.5x5 arcmins for 160 microns.


![Wavelength/
Frequency Flux Units Reference
5GHz 1.63 Jy Morganti et al. (1993)
[OIII] λ5007 -12.82 Log erg/cm2/s Tadhunter et al. (1993)
15GHz core 32.7 mJy Dicken et al. (2008)
22 GHz core 20.7 mJy Dicken et al. (2008)
24 microns 258.3 mJy Dicken et al. (2008)
70 microns 489.7 mJy Dicken et al. (2008)
160 microns 308.7 mJy Dicken et al. (2008)
X-ray - - -](PKS0806-10_files/shapeimage_18.png)


Other name:
Redshift:
RA (j2000):
Dec (j2000):
Optical class:
Radio Class:

0.110
06 26 20.44
-53 41 35.2
NLRG
FRII
3C195

N

E


Notes
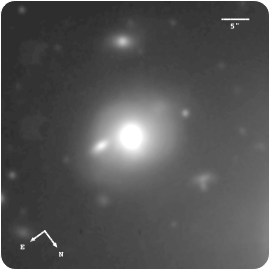
The GMOS-S image of this NLRG/FRII shows a clearly disturbed morphology, including features such as a broad fan towards the east (μ_V = 23.4 mag arcsec^−2), a bright shell to NW and a fainter shell towards the west (μ_V = 23.3 and 24.6 mag arc- sec^−2, respectively: Ramos Almeida et al. 2011a). The unsharp-masked image also shows several bright knots of emission closer to the galaxy centre. Emission-line contamination of the features is not a serious issue here because strong emission lines do not fall in the r′-band filter employed in our observations. Inskip et al. (2010) also report the detection of the NW shell (or arc-like feature) in their K-band images. It is possible that the host galaxy is interacting with a smaller, extended companion object to the east.
The optical spectrum shows a rich, high ionization emission-line spectrum. The optical emission lines are clearly extended in this object. Although the optical continuum spectrum does not require a young stellar population (any UV excess can be explained in terms of AGN-related continuum components), a low EW PAH feature is detected in the Spitzer IRS spectrum (Dicken et al. 2011).
Gemini/GMOS-S: Median filtered image
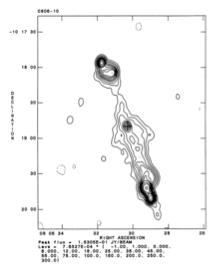
5 GHz VLA radio map
PKS0806-10
Spectral energy distribution. The blue solid line is fitted to the data from 109 to 1010 Hz. Extrapolating this line from the radio to the infrared SED tests whether non-thermal synchrotron emission from the lobes can contaminate the Spitzer mid-infrared flux. In this case the lobes emission lies out of the Spitzer beam so cannot contaminate the Spitzer data. The, flat spectrum, non-thermal radio core emission is also not likely to contaminate the Spitzer infrared flux data for this object.