

Flux data
Available Data Downloads


Infrared data
Radio data
Optical data
X-Ray data


Chandra


Spitzer IRS spectra

PKS0915-11
Spitzer IRS spectra
Dicken et al. (in preperation)


PKS0915-11
Spitzer MIPS infrared photometric observations. Left to right: 24 microns, 70 microns and 160 microns (when available). FOV are 5x5 arcmins for 24 microns, 5x2.5 arcmins for 70 microns and 0.5x5 arcmins for 160 microns.


![Wavelength/
Frequency Flux Units Reference
5GHz 13.78 Jy Morganti et al. (1993)
[OIII] λ5007 -14.50 Log erg/cm2/s Tadhunter et al. (1993)
15GHz core 211.3 mJy Dicken et al. (2008)
22 GHz core 184.5 mJy Dicken et al. (2008)
24 microns 115.3 mJy Dicken et al. (2008)
70 microns 115.3 mJy Dicken et al. (2008)
160 microns 164.0 mJy Dicken et al. (2008)
X-ray - - -](PKS0915-11_files/shapeimage_19.png)


Other name:
Redshift:
RA (j2000):
Dec (j2000):
Optical class:
Radio Class:

0.054
09 18 05.67
-12 05 44.0
WLRG
FRI
Hydra A


Notes
Situated in the Hydra cluster of galaxies, this FRI radio galaxy is one of the most powerful radio sources in the local universe. Its optical spectrum shows weak emission lines, along with absorption lines and a continuum SED that provide evidence for a young stellar population of age ∼0.05 Gyr (Aretxaga et al. 2001; Wills et al. 2004; Holt et al. 2007). Consistent with the optical spectral modelling, the mid-infrared spectrum reveals strong PAH features that trace the young star forming regions (Dicken et al. 2011).
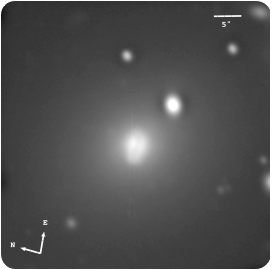
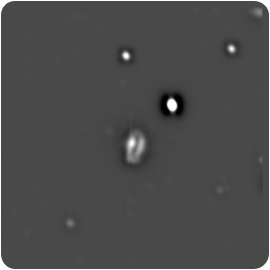
The Gemini GMOS-S r′-band image shows an extended diffuse halo which is typical of central cluster galaxies; it also reveals for the first time a dust lane of diameter 6 kpc crossing the galaxy nucleus. This dust lane appears to be aligned with the rotating disc structure detected by Melnick, Gopal-Krishna & Terlevich (1997).
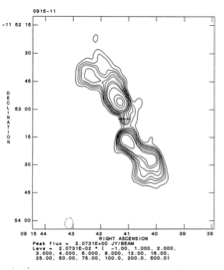
Despite its FRI radio morphology, with inner jets, edge-darkened structure on intermediate scales, and larger-scale diffuse structure that is only detected at low frequencies, Hydra A is one of the most powerful radio sources in the local Universe. Over recent years X-ray imaging observations of this source and its surrounding cluster, which show cavities in the hot ISM that coincide with the large-scale diffuse radio structure, have provided some of the best evidence that radio sources have a major impact on the thermal balance of the intra-cluster medium (Wise et al. 2007).
Gemini/GMOS-S: Unsharp mask image

Images, Maps, Spectra and SEDs
5 GHz VLA radio map
PKS0915-11
Spectral energy distribution. The blue solid line is fitted to the data from 109 to 1010 Hz. Extrapolating this line from the radio to the infrared SED tests whether non-thermal synchrotron emission from the lobes can contaminate the Spitzer mid-infrared flux. In this case the lobes emission lies out of the Spitzer beam so cannot contaminate the Spitzer data. The, flat spectrum, non-thermal radio core emission is also not likely to contaminate the Spitzer infrared flux data for this object.