


Flux data
Available Data Downloads
Images, Maps, Spectra and SEDs


Infrared data
Radio data
Optical data
X-Ray data


Spitzer IRS spectra

PKS1136-13
Spitzer IRS spectra
Dicken et al. (in preperation)

PKS1136-13
Spitzer MIPS infrared photometric observations. Left to right: 24 microns, 70 microns and 160 microns (when available). FOV are 5x5 arcmins for 24 microns, 5x2.5 arcmins for 70 microns and 0.5x5 arcmins for 160 microns.


![Wavelength/
Frequency Flux Units Reference
5GHz 1.9 Jy Morganti et al. (1993)
[OIII] λ5007 -13.39 Log erg/cm2/s Tadhunter et al. (1993)
15GHz core 234.7 mJy Dicken et al. (2008)
22 GHz core 230.4 mJy Dicken et al. (2008)
24 microns 13.8 mJy Dicken et al. (2008)
70 microns 23.9 mJy Dicken et al. (2008)
160 microns <23.2 mJy Dicken et al. (2008)
X-ray - - -](PKS1136-13_files/shapeimage_18.png)


Other name:
Redshift:
RA (j2000):
Dec (j2000):
Optical class:
Radio Class:
0.554
11 39 10.57
-13 50 43.1
Q
FRII
OM-386

Notes
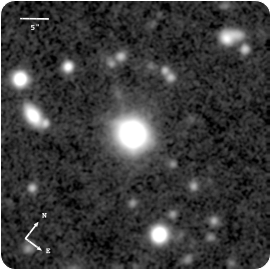
The Gemini GMOS-S image of this QSO/FRII at redshift z = 0.55 reveals the optical counterpart of a radio jet extending up to 60 kpc in the NW from the radio galaxy (Uchiyama et al. 2007). We also detect a shorter tidal tail pointing to the west of the nucleus, for which we measure a surface brightness of μ_V = 22.6 mag arcsec^−2. There are also signs of another tail SE of the nucleus. The lack of either optical long-slit spectra or infrared data suitable for assessing the degree of emission-line contamination of the detected features prevents us from confirming whether the extended structures are dominated by continuum radiation.
The optical spectrum is typical of quasars: broad Balmer lines and rich, high-ionisation narrow-line spectrum, with a blue continuum.
Extrapolation of the high frequency radio core component towards the infrared region of the spectral energy distribution, suggests that the non-thermal core synchrotron emission may contaminate the MFIR flux in this radio galaxy. In addition, further non-thermal contamination by the radio lobes within the Spitzer beam, may be present.

Gemini/GMOS-S: median filtered image
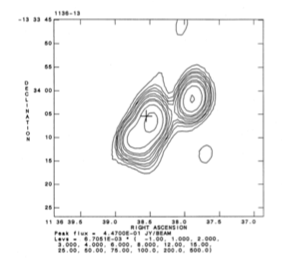
5 GHz VLA radio map
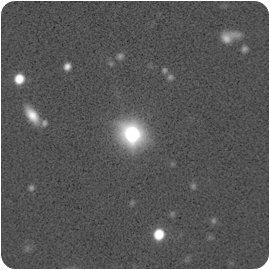
Chandra
PKS1136-13
Spectral energy distribution. The blue solid line is fitted to the data from 109 to 1010 Hz. Extrapolating this line from the radio to the infrared SED tests whether non-thermal synchrotron emission from the lobes can contaminate the Spitzer mid-infrared flux. In this case the lobes emission lies inside the Spitzer beam so non-thermal contamination is a possibility for the Spitzer data. In addition, extrapolating the, flat spectrum, radio core SED into the infrared, shows that the core synchrotron emission could be another possible source of non-thermal contamination to the thermal infrared flux.