


Flux data
Available Data Downloads
Images, Maps, Spectra and SEDs


Infrared data
Radio data
Optical data
X-Ray data


Spitzer IRS spectra
PKS1151-34
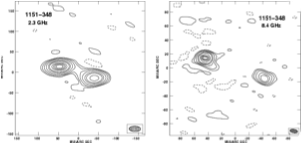
PKS 1151-348 at 2291 MHz from the SHEVE array. The peak level is 1.57 Jy/beam and contours are shown at -0.75, 0.75, 1.5, 3, 6, 12, 18, 35, 50, 65, 80% of the peak. ( Right) PKS 1151-348 at 8421 MHz from the SHEVE array. The peak level is 0.44 Jy/beam and contours are shown at -1.5, 1.5, 3, 6, 12, 18, 35, 50, 65, 80% of the peak.

PKS1151-34
Spitzer IRS spectra
Dicken et al. (in preperation)

PKS1151-34
Spitzer MIPS infrared photometric observations. Left to right: 24 microns, 70 microns and 160 microns (when available). FOV are 5x5 arcmins for 24 microns, 5x2.5 arcmins for 70 microns and 0.5x5 arcmins for 160 microns.


![Wavelength/
Frequency Flux Units Reference
5GHz 2.78 Jy Morganti et al. (1993)
[OIII] λ5007 -13.95 Log erg/cm2/s Tadhunter et al. (1993)
15GHz core - mJy Dicken et al. (2008)
22 GHz core - mJy Dicken et al. (2008)
24 microns 16.4 mJy Dicken et al. (2008)
70 microns 51.5 mJy Dicken et al. (2008)
160 microns <46.3 mJy Dicken et al. (2008)
X-ray - - -](PKS1151-34_files/shapeimage_19.png)


Other name:
Redshift:
RA (j2000):
Dec (j2000):
Optical class:
Radio Class:

0.258
11 54 21.79
-35 05 29.1
Q
CSS
OM-386

Notes
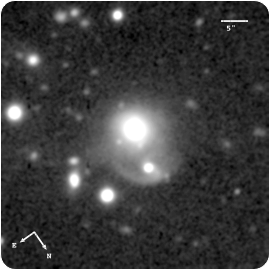
The presence of a young stellar population in this QSO/CSS is indicated by the low EW PAH feature detected in its Spitzer MIR spectrum (Dicken et al. 2011). The optical Gemini GMOS-S image reveals a spectacular extended structure for this system, with a prominent tidal tail/arc feature ∼34 kpc to the NW that connects to a compact secondary nucleus ∼27 kpc to the north of the quasar, as well as a broad fan of emission extending ∼38 kpc to the east of the nucleus. The overall morphology of the extended structure to the N-NW suggests that the quasar host galaxy is strongly interacting with a late-type spiral galaxy (possibly a barred spiral galaxy). Since the spiral structure of the interacting galaxy is reasonably coherent (although somewhat asymmetric), it appears that we are observing the system around the first pericentre passage of the interacting galaxies, rather than in the final stages of a merger as the nuclei coalesce. For this galaxy there are neither optical spectra nor infrared data suitable for assessing the degree of emission-line contamination of the detected features.
The optical spectrum is characteristic of BLRG/Q: rich, high-ionization narrow-line spectrum, strong, highly structured Balmer lines, and a blue continuum.
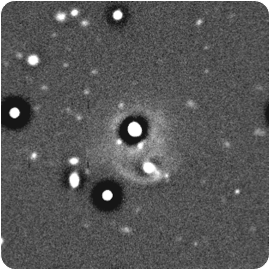
Gemini/GMOS-S: median filtered image
XMM
PKS1151-34
Spectral energy distribution. The blue solid line is fitted to the data from 109 to 1010 Hz. Extrapolating this line from the radio to the infrared SED tests whether non-thermal synchrotron emission from the lobes can contaminate the Spitzer mid-infrared flux. In this case the lobes emission lies out of the Spitzer beam so cannot contaminate the Spitzer data. The weak, flat spectrum, non-thermal radio core emission is also not likely to contaminate the Spitzer infrared flux data for this object.