

Flux data
Available Data Downloads
Images, Maps, Spectra and SEDs


Infrared data
Radio data
Optical data
X-Ray data


Spitzer IRS spectra
PKS1306-09
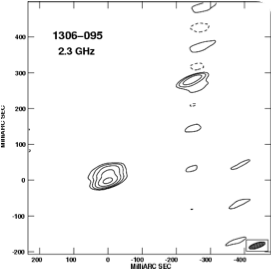
PKS 1306-095 at 2291 MHz from the SHEVE array. The peak level is 0.30 Jy/beam and contours are shown at -5, 5, 10, 20, 40, 80% of the peak.

PKS1306-09
Spitzer IRS spectra
Dicken et al. (in preperation)


PKS1306-09
Spitzer MIPS infrared photometric observations. Left to right: 24 microns, 70 microns and 160 microns (when available). FOV are 5x5 arcmins for 24 microns, 5x2.5 arcmins for 70 microns and 0.5x5 arcmins for 160 microns.


![Wavelength/
Frequency Flux Units Reference
5GHz 1.9 Jy Morganti et al. (1993)
[OIII] λ5007 -14.79 Log erg/cm2/s Tadhunter et al. (1993)
15GHz core - mJy Dicken et al. (2008)
22 GHz core - mJy Dicken et al. (2008)
24 microns 4.6 mJy Dicken et al. (2008)
70 microns 21.7 mJy Dicken et al. (2008)
160 microns <29.2 mJy Dicken et al. (2008)
X-ray - - -](PKS1306-09_files/shapeimage_19.png)


Other name:
Redshift:
RA (j2000):
Dec (j2000):
Optical class:
Radio Class:

0.464
13 08 39.17
-09 50 32.6
NLRG
CSS
-

N

E


Notes
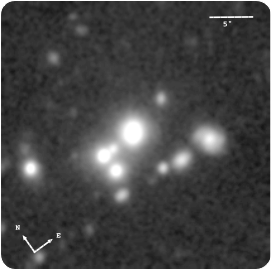
The Gemini GMOS-S optical image reveals a secondary nucleus for this NLRG/CSS source (Ramos Almeida et al. 2011a), which is also detected in the residuals of the model-subtracted K-band image analysed by Inskip et al. (2010). The galaxy lies in a group of galaxies. From both the optical and NIR data, the radio galaxy is very likely undergoing interactions with other objects in the group. In addition to the double nucleus, we detect a sharply defined shell ∼20 kpc to SE of the radio galaxy, of surface brightness μ_V =24.5 mag arcsec^−2.
This CSS radio galaxy has a large UV excess, only narrow emission lines, and significant UV polarization. Emission lines [OIII]5007, 4959 and H are detected, but the ionization state is only moderate. The information about the continuum is limited, but the Ca II H line is marginally detected. Details of the ionization and kinematics of the emission line gas in this source are discussed in Holt et al. (2008, MNRAS, 387, 639) and Holt et al. (2009, MNRAS, 400, 589) respectively.
Given that the polarization E-vector angle is closer to the parallel than the perpendicular to the radio axis, the polarization mechanism may not be anisotropic scattering, but some alternative mechanism such as dichroic absorption or synchrotron emission. The low level of intrinsic polarization suggests that if the polarization mechanism is anisotropic scattering, the scattered component does not dominate the UV excess (Tadhunter et al. 2002).
Extrapolation of the radio spectrum suggests the non-thermal synchrotron radio lobe emission may contaminate the MFIR flux in this radio galaxy, because the lobes lie within the Spitzer beam (Dicken et al. 2008).
Gemini/GMOS-S: median filtered image

XMM
PKS1306-09
Spectral energy distribution. The blue solid line is fitted to the data from 109 to 1010 Hz. Extrapolating this line from the radio to the infrared SED tests whether non-thermal synchrotron emission from the lobes can contaminate the Spitzer mid-infrared flux. In this case the lobes emission lies inside the Spitzer beam so non-thermal contamination is a possibility for the Spitzer data. However, the weak, flat spectrum, non-thermal radio core emission is not likely to contaminate the Spitzer infrared flux data for this object.