


Flux data
Available Data Downloads
Images, Maps, Spectra and SEDs


Infrared data
Radio data
Optical data
X-Ray data


Spitzer IRS spectra

PKS1355-41
Spitzer IRS spectra
Dicken et al. (in preperation)

PKS1355-41
Spitzer MIPS infrared photometric observations. Left to right: 24 microns, 70 microns and 160 microns (when available). FOV are 5x5 arcmins for 24 microns, 5x2.5 arcmins for 70 microns and 0.5x5 arcmins for 160 microns.


![Wavelength/
Frequency Flux Units Reference
5GHz 1.44 Jy Morganti et al. (1993)
[OIII] λ5007 -13.70 Log erg/cm2/s Tadhunter et al. (1993)
15GHz core 102.7 mJy Dicken et al. (2008)
22 GHz core 89.6 mJy Dicken et al. (2008)
24 microns 53.1 mJy Dicken et al. (2008)
70 microns 66.3 mJy Dicken et al. (2008)
160 microns <55.9 mJy Dicken et al. (2008)
X-ray - - -](PKS1355-41_files/shapeimage_18.png)


Other name:
Redshift:
RA (j2000):
Dec (j2000):
Optical class:
Radio Class:

0.313
13 59 00.23
-41 52 54.1
Q
FRII
-

Notes
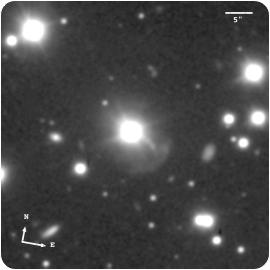
The Gemini observations of this QSO at redshift z = 0.31 has the best seeing among all the GMOS-S observations of the 2Jy sample (FWHM ∼ 0.4 arcsec). This fact is clearly reflected in the high quality of the images and the level of detail of the identified features. There is a sharp shell feature ∼24 kpc to the SE of the quasar and covering an angle of ∼60 degrees, along with a bright and narrow tail extending up to ∼22 kpc to the SE along PA = 121 degrees and pointing towards the arc. Although the latter feature is closely aligned with the axis of the large-scale radio structure (PA = 125 degrees), the high-frequency radio map presented in Dicken et al. (2008) shows no sign of any radio emission from the tail that might suggest that it is non-thermal in nature. For this galaxy, there are neither optical long-slit spectra nor infrared data suitable for assessing the degree of emission-line contamination of the detected features.
The optical spectrum shows the quasar: strong, broad Balmer lines, blue continuum and [OIII]λλ5007, 4959 lines of moderate strength.
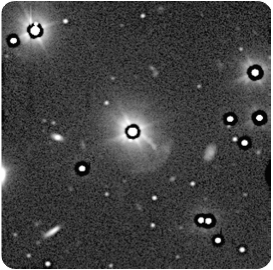
Gemini/GMOS-S: median filtered image
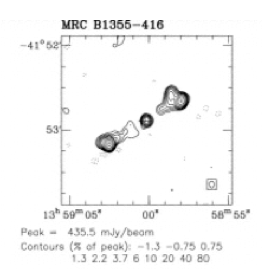
5 GHz ATCA radio map
XMM
PKS1355-41
Spectral energy distribution. The blue solid line is fitted to the data from 109 to 1010 Hz. Extrapolating this line from the radio to the infrared SED tests whether non-thermal synchrotron emission from the lobes can contaminate the Spitzer mid-infrared flux. In this case the lobes emission lies out of the Spitzer beam so cannot contaminate the Spitzer data. The weak, flat spectrum, non-thermal radio core emission is also not likely to contaminate the Spitzer infrared flux data for this object.