

Flux data
Available Data Downloads
Images, Maps, Spectra and SEDs


Infrared data
Radio data
Optical data
X-Ray data


Chandra

Spitzer IRS spectra

PKS1559+02
Spitzer IRS spectra
Dicken et al. (in preperation)


PKS1559+02
Spitzer MIPS infrared photometric observations. Left to right: 24 microns, 70 microns and 160 microns (when available). FOV are 5x5 arcmins for 24 microns, 5x2.5 arcmins for 70 microns and 0.5x5 arcmins for 160 microns.


![Wavelength/
Frequency Flux Units Reference
5GHz 2.87 Jy Morganti et al. (1993)
[OIII] λ5007 -13.30 Log erg/cm2/s Tadhunter et al. (1993)
15GHz core 15.2 mJy Dicken et al. (2008)
22 GHz core 11.2 mJy Dicken et al. (2008)
24 microns 242.0 mJy Dicken et al. (2008)
70 microns 470.0 mJy Dicken et al. (2008)
160 microns 262.8 mJy Dicken et al. (2008)
X-ray - - -](PKS1559+02_files/shapeimage_18.png)


Other name:
Redshift:
RA (j2000):
Dec (j2000):
Optical class:
Radio Class:

0.104
16 02 27.38
+01 57 55.7
NLRG
FRII
3C327

N

E


Notes
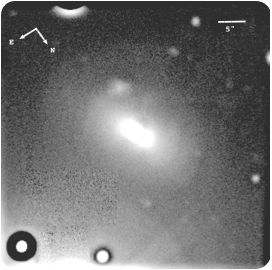
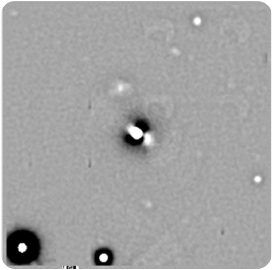
The WFPC2/HST images of this NLRG/FRII source reveal a bifurcated dust lane structure extending ∼3 kpc to the NE of the galaxy nucleus, with the radio axis lying roughly perpendicular to the dust lanes. The nuclear structure, as revealed by the HST image, appears to be complex and possibly double (de Koff et al. 1996, 2000). The presence of a bright star close to the galaxy complicates its morphological classification. However, by looking at our processed Gemini GMOS-S images (unsharp-masked and especially smoothed galaxy-subtracted) the presence of dust lanes becomes clear. The galaxy nucleus appears double as well, but it is difficult to say whether is intrinsically double or just apparently divided by the dust lane. On larger scales the GMOS-S image reveals a system of sharply defined shells at radii of ∼16 and 30 kpc to the SE, and ∼14 and 22 kpc to the NW; these sharply defined shell features are reminiscent of the systems of shells detected around some elliptical galaxies in the nearby Universe by Malin & Carter (1983). We measure surface brightnesses of μ_V = 23.2 and 23.6 mag arcsec^−2 for the inner and outer shells, respectively. The larger of the shells to the SE was also detected by Heckman et al. (1986), while Inskip et al. (2010) detected the inner shell to the SE (16 kpc radial distance form the nucleus) in the near-infrared K-band, claiming that an elongated tidal feature appears to be connecting the galaxy nucleus with a satellite object to the south. Emission-line contamination can be ruled out, since strong emission lines do not fall in the r′ filter used for the observations.

Gemini/GMOS-S: Unsharp mask image

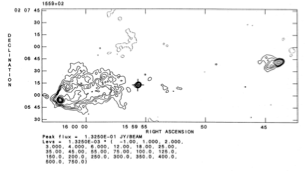
5 GHz VLA radio map
PKS1559+02
Spectral energy distribution. The blue solid line is fitted to the data from 109 to 1010 Hz. Extrapolating this line from the radio to the infrared SED tests whether non-thermal synchrotron emission from the lobes can contaminate the Spitzer mid-infrared flux. In this case the lobes emission lies out of the Spitzer beam so cannot contaminate the Spitzer data. The weak, flat spectrum, non-thermal radio core emission is also not likely to contaminate the Spitzer infrared flux data for this object.