


Flux data
Available Data Downloads
Images, Maps, Spectra and SEDs


Infrared data
Radio data
Optical data
X-Ray data


Spitzer IRS spectra
PKS1602+01
(Top) 5Ghz
Image of 1602+01 at 6-cm. The contour levels are: , 1, 2, 3, 4, 6, 8, 10, 12, 14, 16, 20, 25, 30, 40, 50, 75, 100, 125 mJy beam-1. The peak flux is 94.5 mJy beam-1. Image of 1602+01 at 6-cm with superimposed vectors indicating the projected electric field direction. The vectors are proportional in length to the fractional polarisation (1 arcsec = 0.5 ratio). The contour levels are: , 1, 2, 4, 8, 16, 32, 64 mJy beam-1. The peak flux is 94.5 mJy beam-1

PK1602+01
Spitzer IRS spectra
Dicken et al. (in preperation)

PKS1602+01
Spitzer MIPS infrared photometric observations. Left to right: 24 microns, 70 microns and 160 microns (when available). FOV are 5x5 arcmins for 24 microns, 5x2.5 arcmins for 70 microns and 0.5x5 arcmins for 160 microns.


![Wavelength/
Frequency Flux Units Reference
5GHz 1.13 Jy Morganti et al. (1993)
[OIII] λ5007 -14.20 Log erg/cm2/s Tadhunter et al. (1993)
15GHz core 63.7 mJy Dicken et al. (2008)
22 GHz core 65.5 mJy Dicken et al. (2008)
24 microns 7.7 mJy Dicken et al. (2008)
70 microns 12.3 mJy Dicken et al. (2008)
160 microns <32.4 mJy Dicken et al. (2008)
X-ray - - -](PKS1602+01_files/shapeimage_18.png)


Other name:
Redshift:
RA (j2000):
Dec (j2000):
Optical class:
Radio Class:
0.462
16 04 45.35
+01 17 50.8
BLRG
FRII
3C327.1

Notes
At radio wavelengths this source is dominated by a one sided knotty jet to the SE of the nucleus (Morganti et al. 1999). In terms of its high degree of curvature, this jet shows clear morphological similarities with PKS0035−02. Similarities are also present in the optical spectra of the two objects. In fact, in the optical PKS1602+01 has a high ionization emission line spectrum showing (as 0035−02) broad components to the Balmer lines (Shaw et al. 1995; Tadhunter et al. 2002). The [OII] λ3727 and [OIII] λ5007 may be slightly extended.
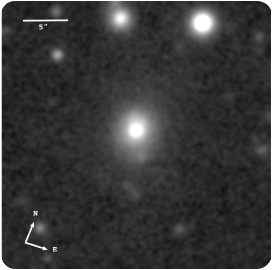
The Gemini GMOS-S optical image shows several signs of interaction. Towards the north of the galaxy nucleus we detect a bright and smooth fan of μ_V = 21.34 mag arcsec^−2 . On the opposite side there is a shell of μ_V = 23.3 mag arcsec^−2. In addition, and immersed in the shell envelope, we detect a sharp knot-like feature that extends up to 23 kpc and that is closely aligned (PA = 148 degrees) with the inner axis of the radio jet (PA = 145 degrees: see radio images in Morganti et al. 1999). At a distance of 18 kpc from the nucleus, the latter feature is close to, but does not exactly coincide with, the third knot in the radio jet leading to the south of the nucleus. The WFPC2/HST images of this galaxy only revealed an elliptical nucleus with a faint halo of emission surrounding it (de Koff et al. 1996). For this galaxy, there are neither optical long-slit spectra nor infrared data suitable for assessing the degree of emission-line contamination of the detected features.
Based on the extrapolation of the high frequency radio core component towards the infrared region of the spectral energy distribution, non-thermal core synchrotron emission may contaminate the MFIR flux in this radio galaxy (Dicken et al. 2008).

Gemini/GMOS-S: median filtered image
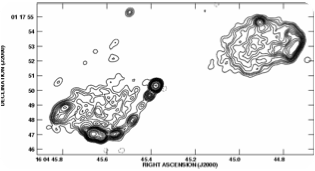
6cm VLA radio map
XMM
PKS1602+01
Spectral energy distribution. The blue solid line is fitted to the data from 109 to 1010 Hz. Extrapolating this line from the radio to the infrared SED tests whether non-thermal synchrotron emission from the lobes can contaminate the Spitzer mid-infrared flux. In this case the lobes emission lies out of the Spitzer beam so cannot contaminate the Spitzer data. However, extrapolating the, flat spectrum, radio core SED into the infrared, shows that the core synchrotron emission could be a possible source of non-thermal contamination to the thermal infrared flux.