


Flux data
Available Data Downloads
Images, Maps, Spectra and SEDs


Infrared data
Radio data
Optical data
X-Ray data


Chandra

Spitzer IRS spectra

PKS1733-56
Spitzer IRS spectra
Dicken et al. (in preperation)

PKS1733-56
Spitzer MIPS infrared photometric observations. Left to right: 24 microns, 70 microns and 160 microns (when available). FOV are 5x5 arcmins for 24 microns, 5x2.5 arcmins for 70 microns and 0.5x5 arcmins for 160 microns.


![Wavelength/
Frequency Flux Units Reference
5GHz 3.37 Jy Morganti et al. (1993)
[OIII] λ5007 -13.69 Log erg/cm2/s Tadhunter et al. (1993)
15GHz core 293.6 mJy Dicken et al. (2008)
22 GHz core 269.4 mJy Dicken et al. (2008)
24 microns 29.2 mJy Dicken et al. (2008)
70 microns 151.0 mJy Dicken et al. (2008)
160 microns 318.2 mJy Dicken et al. (2008)
X-ray - - -](PKS1733-56_files/shapeimage_19.png)


Other name:
Redshift:
RA (j2000):
Dec (j2000):
Optical class:
Radio Class:

0.098
17 37 35.80
-56 34 03.4
BLRG
FRII
-

N

E

Notes
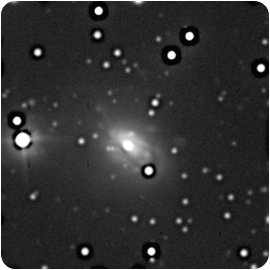
This BLRG/FRII, with evidence for starburst activity provided by its FIR excess and strong PAH features in its MIR spectrum (Dicken et al. 2009, 2010), lies in a relatively crowded field. Its optical morphology, as revealed by our Gemini GMOS-S image, is highly disturbed, showing at least two tidal tails: a shorter one pointing to the west and a longer one to the SE both having μ_V = 23.6 mag arcsec^−2. We also detect several arc-like irregular features, including a smooth, inner one (of μ_V = 23.6 mag arcsec^−2 ) up to 6.5 kpc in the SE direction and a larger one of μ_V = 24 mag arcsec^−2 extended up to 11.6 kpc to the NW. It is likely that at least part of the complex structure visible in the central regions of the galaxy is due to obscuration by a complex system of dust lanes. The brightest inner arc-like irregular structure is detected in the K-band, model-subtracted images presented by Inskip et al. (2010), who also suggest that the residuals from the subtraction display an excess of emission aligned with the major axis of the galaxy. In the outermost part of the radio galaxy host we also detect an interlocking series of fainter shells that extend to a maximum radius of ∼25 kpc to the SE and ∼17 kpc to the south. We measure surface brightnesses of μ_V = 24.4 and 24.0 mag arcsec^−2 for these outer shells, respectively. Emission-line contamination is not a serious issue in our GMOS-S image, since strong emission lines do not fall in the r′-band filter used for the observations. Based on integral-field spectroscopic observations, Bryant & Hunstead (2002) found evidence for a disturbed morphology, disrupted gas rotation and patchy starburst emission for this source. They claimed that the most plausible explanation for all of these features is an interaction or merger with an SE companion from which the radio galaxy would be accreting gas, but they did not find such a merging galaxy in the DSS-II and SuperCOSMOS images; our deeper GMOS-S image does not show any secondary nucleus.
Note that the BLRG classification of this object is based on the detection of a broad Hα line in its optical spectrum (Hunstead et al. 1982, PASAu, 4, 447; Simpson et al. (1996, MNRAS, 281, 509).
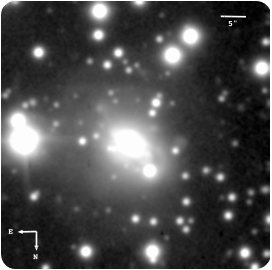
Gemini/GMOS-S: Unsharp mask image
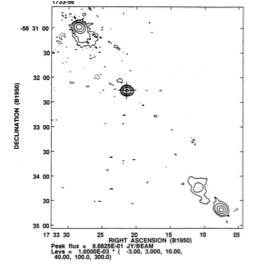
5 GHz ATCA radio map
ATCA 5GHz
PKS1733-56
Spectral energy distribution. The blue solid line is fitted to the data from 109 to 1010 Hz. Extrapolating this line from the radio to the infrared SED tests whether non-thermal synchrotron emission from the lobes can contaminate the Spitzer mid-infrared flux. In this case the lobes emission lies out of the Spitzer beam so cannot contaminate the Spitzer data. The weak, flat spectrum, non-thermal radio core emission is also not likely to contaminate the Spitzer infrared flux data for this object.