

Flux data
Available Data Downloads
Images, Maps, Spectra and SEDs


Infrared data
Radio data
Optical data
X-Ray data

Chandra

Spitzer IRS spectra

PKS1839-48
Spitzer IRS spectra
Dicken et al. (in preperation)


PKS1839-48
Spitzer MIPS infrared photometric observations. Left to right: 24 microns, 70 microns and 160 microns (when available). FOV are 5x5 arcmins for 24 microns, 5x2.5 arcmins for 70 microns and 0.5x5 arcmins for 160 microns.


![Wavelength/
Frequency Flux Units Reference
5GHz 1.28 Jy Morganti et al. (1993)
[OIII] λ5007 <-16.22 Log erg/cm2/s Tadhunter et al. (1993)
15GHz core 108.2 mJy Dicken et al. (2008)
22 GHz core 100.9 mJy Dicken et al. (2008)
24 microns 3.1 mJy Dicken et al. (2008)
70 microns 10.9 mJy Dicken et al. (2008)
160 microns - mJy Dicken et al. (2008)
X-ray - - -](PKS1839-48_files/shapeimage_17.png)


Other name:
Redshift:
RA (j2000):
Dec (j2000):
Optical class:
Radio Class:

0.112
18 43 14.64
-48 36 23.3
WLRG
FRI
-


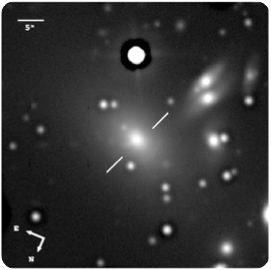
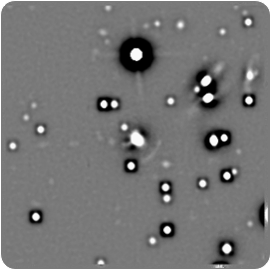
Gemini/GMOS-S: Unsharp mask image

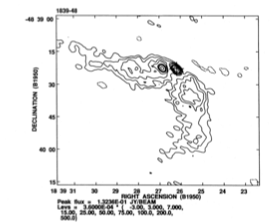
5 GHz ATCA radio map
Notes
This object is an FRI a radio galaxy. Our ATCA image shows a core and a wide-angle tail-like emission trailing away. There is an unidentified compact component to the east of the core.
This WLRG galaxy is the brightest member of a group or cluster, with its spectrum presenting several absorption lines typical of early-type galaxies, but no strong emission lines (Tadhunter et al. 1993). Our Gemini GMOS-S image shows an apparent secondary nucleus within a 5.6 kpc radius to the SE, a bright arc-like shell ∼7kpc to the NW, and a tentative narrow and sharp tail NE. It is also possible that the radio galaxy is interacting with the two galaxies aligned along the SW direction, since at least one them appears clearly disturbed. Emission-line contamination can be ruled out, since strong emission lines do not fall in the filter used. The bright and sharp shell-like feature described above appears different to the shells/arcs detected for other galaxies in our sample. Indeed, considering that PKS 1839−48 is a massive galaxy immersed in a rich environment, we cannot discard the possibility of this arc/shell being the result of gravitational lensing.
Based on the extrapolation of the high frequency radio core component towards the infrared region of the spectral energy distribution, it is possible that the non-thermal core synchrotron emission may contaminate MFIR flux of this radio galaxy. In addition, further non-thermal contamination from the radio lobes within the Spitzer beam may be present.
ATCA 5GHz
PKS1839-48
Spectral energy distribution. The blue solid line is fitted to the data from 109 to 1010 Hz. Extrapolating this line from the radio to the infrared SED tests whether non-thermal synchrotron emission from the lobes can contaminate the Spitzer mid-infrared flux. In this case the lobes emission lies inside the Spitzer beam so non-thermal contamination is a possibility for the Spitzer data. In addition, extrapolating the, flat spectrum, radio core SED into the infrared, shows that the core synchrotron emission could be another possible source of non-thermal contamination to the thermal infrared flux.