

Flux data
Available Data Downloads
Images, Maps, Spectra and SEDs


Infrared data
Radio data
Optical data
X-Ray data


Spitzer IRS spectra
PKS1938-15
(TOP) 5GHz
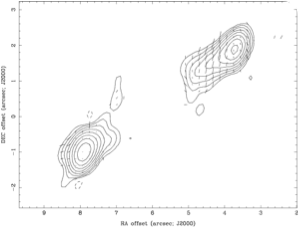
(Middle) Image of 1938-15 at 6-cm (VLA data) with superimposed vectors indicating the projected electric field direction. The vectors are proportional in length to the fractional polarisation (1 arcsec = 1.05 ratio). The contour levels are: , 1, 2, 4, 8, 16, 32, 64, 128 mJy beam-1. The peak flux is 1.160 Jy beam-1. (Bottom Left) ATCA image of 1938-15 at 3-cm (full resolution) with superimposed vectors indicating the projected electric field direction. The vectors are proportional in length to the fractional polarisation (1 arcsec = 0.07 ratio). The contour levels are: , 1, 2, 4, 8, 16, 32, 64, 128 mJy beam-1. The peak flux is 658.5 mJy beam-1; (Bottom Right) ATCA image of 1938-15 at 6-cm with superimposed vectors indicating the projected electric field direction. The vectors are proportional in length to the fractional polarisation. The contour levels are: , 1, 2, 4, 8, 16, 32, 64, 128, 256 mJy beam-1. The peak flux is 1.240 Jy beam-1. The cross indicates the position (from Prestage & Peacock 1983) of the optical galaxy.

PKS1938-15
Spitzer IRS spectra
Dicken et al. (in preperation)


PKS1938-15
Spitzer MIPS infrared photometric observations. Left to right: 24 microns, 70 microns and 160 microns (when available). FOV are 5x5 arcmins for 24 microns, 5x2.5 arcmins for 70 microns and 0.5x5 arcmins for 160 microns.


![Wavelength/
Frequency Flux Units Reference
5GHz 2.34 Jy Morganti et al. (1993)
[OIII] λ5007 -14.22 Log erg/cm2/s Tadhunter et al. (1993)
15GHz core - mJy Dicken et al. (2008)
22 GHz core - mJy Dicken et al. (2008)
24 microns 6.8 mJy Dicken et al. (2008)
70 microns 19.7 mJy Dicken et al. (2008)
160 microns mJy Dicken et al. (2008)
X-ray - - -](PKS1938-15_files/shapeimage_18.png)


Other name:
Redshift:
RA (j2000):
Dec (j2000):
Optical class:
Radio Class:

0.452
19 41 15.15
-15 24 30.9
BLRG
FRII
OV-164


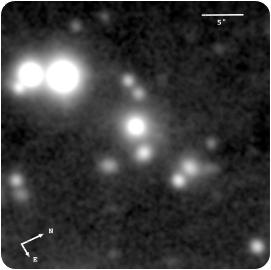
Gemini/GMOS-S: median filtered image
6cm VLA radio map
XMM
Notes
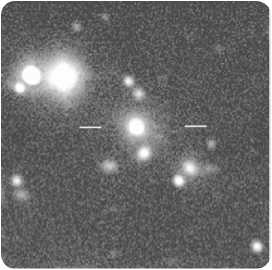
This BLRG/FRII lies in a very dense environment, and in our Gemini GMOS-s optical image appears to have several diffuse companions within a 10 arcsec radius. We detect a tail/fan of μ_V = 23.2 mag arcsec^−2 extending up to 20 kpc to the NE of the radio galaxy: Ramos Almeida et al. 2011a). It also looks very probable that PKS 1938−15 is interacting with the companion lying at 18 kpc to the east. There are neither optical long-slit spectra nor infrared data suitable for assessing the degree of emission-line contamination of the detected features in this galaxy.
The optical spectrum is rich with high ionization emission lines. This radio galaxy shows broad Hβ and Mg ii(2800) emission lines in its optical/UV spectrum, but is not significantly polarized in the UV (Tadhunter et al. 2002). Therefore its UV excess is likely to be dominated by direct AGN light.

PKS1938-15
Spectral energy distribution. The blue solid line is fitted to the data from 109 to 1010 Hz. Extrapolating this line from the radio to the infrared SED tests whether non-thermal synchrotron emission from the lobes can contaminate the Spitzer mid-infrared flux. In this case the lobes emission lies inside of the Spitzer beam. However, the weak, flat spectrum, non-thermal radio core emission is also not likely to contaminate the Spitzer infrared flux data for this object.