


Flux data
Available Data Downloads


Infrared data
Radio data
Optical data
X-Ray data


Chandra


Spitzer IRS spectra

PKS1949+02
Spitzer IRS spectra
Dicken et al. (in preperation)

PKS1949+02
Spitzer MIPS infrared photometric observations. Left to right: 24 microns, 70 microns and 160 microns (when available). FOV are 5x5 arcmins for 24 microns, 5x2.5 arcmins for 70 microns and 0.5x5 arcmins for 160 microns.


PKS1949+02
![Wavelength/
Frequency Flux Units Reference
5GHz 2.39 Jy Morganti et al. (1993)
[OIII] λ5007 -13.13 Log erg/cm2/s Tadhunter et al. (1993)
15GHz core 20.0 mJy Dicken et al. (2008)
22 GHz core 8.5 mJy Dicken et al. (2008)
24 microns 193.0 mJy Dicken et al. (2008)
70 microns 348.4 mJy Dicken et al. (2008)
160 microns 251.3 mJy Dicken et al. (2008)
X-ray - - -](PKS1949+02_files/shapeimage_20.png)


Other name:
Redshift:
RA (j2000):
Dec (j2000):
Optical class:
Radio Class:

0.059
19 52 15.77
+02 30 23.1
NLRG
FRII
3C403

N

E

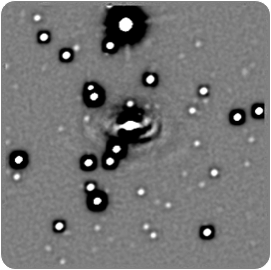
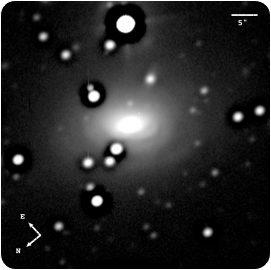
Gemini/GMOS-S: Unsharp mask image
Images, Maps, Spectra and SEDs
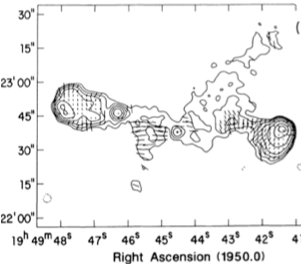
6cm VLA radio map
Notes
This NLRG/FRII galaxy with an X-shaped radio morphology (Black et al. 1992) was observed in the optical with HST by Martel et al. (1999) and de Koff et al. (2000), who reported the existence of dust lanes and a low-surface brightness halo with a sharp boundary surrounding the central region at a radius of ∼2.5 arcsec. Our Gemini optical image confirms the latter feature, and, for the first time, also reveals an extraordinary series of concentric arc/shell features extending to a maximum radius of ∼12 kpc to the west, and ∼20 kpc to the south (Ramos Almeida et al. 2011a). The brightest of these shell features has a corrected surface brightness of μ_V = 22.6 mag arcsec^−2 . The K-band model-subtracted residual images presented in Inskip et al. (2010) reveal hints of the shells, indicating their continuum-emitting nature. Our long-slit spectra confirm that the outer arc and shell features are not dominated by emission-line radiation. It is possible that this source has undergone merger activity in the relatively recent past. The X-shaped radio source has been linked to rapid jet reorientation ∼10^7 yr previously (Dennett-Thorpe et al. 2002).
The optical spectrum reveals high-ionization emission lines of high equivalent width.
PKS1949+02
Spectral energy distribution. The blue solid line is fitted to the data from 109 to 1010 Hz. Extrapolating this line from the radio to the infrared SED tests whether non-thermal synchrotron emission from the lobes can contaminate the Spitzer mid-infrared flux. In this case the lobes emission lies out of the Spitzer beam so cannot contaminate the Spitzer data. The weak, flat spectrum, non-thermal radio core emission is also not likely to contaminate the Spitzer infrared flux data for this object.