


Flux data
Available Data Downloads
Images, Maps, Spectra and SEDs


Infrared data
Radio data
Optical data
X-Ray data


Chandra


Spitzer IRS spectra
PKS1954-55
(Top left) Image of 1954-55 at 3-cm (full resolution) with superimposed vectors indicating the projected electric field direction. The vectors are proportional in length to the fractional polarisation (1 arcsec = 0.54 ratio). The contour levels are: , 1, 2, 4, 8, 16, 32 mJy beam-1. The peak flux is 54.5 mJy beam-1. (Top right) Image of 1954-55 at 6-cm with superimposed vectors indicating the projected electric field direction. The vectors are proportional in length to the fractional polarisation (1 arcsec = 0.029 ratio). The contour levels are: , 1, 2, 4, 8, 16, 32 mJy beam-1. The peak flux is 94.0 mJy beam-1.

PKS1954-55
Spitzer IRS spectra
Dicken et al. (in preperation)

PKS1954-55
Spitzer MIPS infrared photometric observations. Left to right: 24 microns, 70 microns and 160 microns (when available). FOV are 5x5 arcmins for 24 microns, 5x2.5 arcmins for 70 microns and 0.5x5 arcmins for 160 microns.


![Wavelength/
Frequency Flux Units Reference
5GHz 2.31 Jy Morganti et al. (1993)
[OIII] λ5007 <-16.00 Log erg/cm2/s Tadhunter et al. (1993)
15GHz core 61.7 mJy Dicken et al. (2008)
22 GHz core 61.6 mJy Dicken et al. (2008)
24 microns 2.7 mJy Dicken et al. (2008)
70 microns 8.8 mJy Dicken et al. (2008)
160 microns <34.1 mJy Dicken et al. (2008)
X-ray - - -](PKS1954-55_files/shapeimage_18.png)


Other name:
Redshift:
RA (j2000):
Dec (j2000):
Optical class:
Radio Class:
0.060
19 58 16.06
-55 09 37.5
WLRG
FRI
-
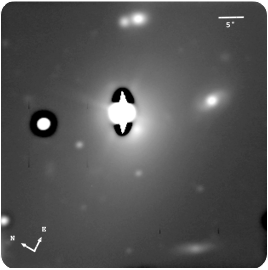


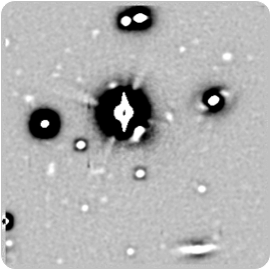
Gemini/GMOS-S: Unsharp mask image
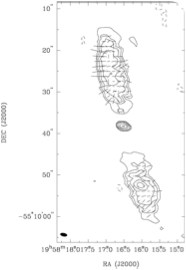
3cm ATCA radio map
Notes
This is an FRI source comprising two jet-like structures. When observed at low frequency and low resolution (Jones & Mc Adams 1992), this object is embedded in an elongated and bent low-brightness halo extending more than 5 arcmin. Neither jet shows evidence for significant depolarization. The rotation measure is quite uniform in the southern lobe (∼ 126 rad m^−2). In the northern lobe, most of the lobe shows a value of around 18 rad m^−2 except in a region (south-west) where the values are around ∼ −83 rad m^−2.
In the optical spectrum weak H + [NII] is detected, but no [OIII]5007 or [OII]3727 lines of large equivalent widths.
The Gemini optical imaging of this galaxy reveals its location in a rich environment. The presence of a bright star close (in projection) to the nucleus precludes detailed examination of the morphology of the central regions of the galaxy, but our Gemini image shows no sign of morphological disturbance in its halo, consistent with the earlier results of Fasano, Falomo & Scarpa (1996). The galaxy belongs to a group of WLRGs in our sample which do not present evidence for galaxy mergers/interactions.
Based on the extrapolation of the high frequency radio core component towards the infrared region of the spectral energy distribution, it is possible that the non-thermal core synchrotron emission may contaminate the thermal infrared flux in this radio galaxy (Dicken et al. 2008).
PKS1954-55
Spectral energy distribution. The blue solid line is fitted to the data from 109 to 1010 Hz. Extrapolating this line from the radio to the infrared SED tests whether non-thermal synchrotron emission from the lobes can contaminate the Spitzer mid-infrared flux. In this case the lobes emission lies inside the Spitzer beam so non-thermal contamination is a possibility for the Spitzer data. In addition, extrapolating the, flat spectrum, radio core SED into the infrared, shows that the core synchrotron emission could be another possible source of non-thermal contamination to the thermal infrared flux.