PKS2135-14

Flux data

Available Data Downloads

Images, Maps, Spectra and SEDs

(definitions)Definitions.html
link to NED pagehttp://nedwww.ipac.caltech.edu/cgi-bin/nph-objsearch?objname=2135-14&extend=no&hconst=73&omegam=0.27&omegav=0.73&corr_z=1&out_csys=Equatorial&out_equinox=J2000.0&obj_sort=RA+or+Longitude&of=pre_text&zv_breaker=30000.0&list_limit=5&img_stamp=YES

Infrared data

Radio data

Optical data

X-Ray data

Spitzer 70um DataPKS2135-14_files/2135_14_70um.fits
Spitzer 160um DataPKS2135-14_files/2135_20_160um.fits

Chandra

VLA 5GHz

ESO Optical spectraPKS2135-14_files/s2135_14.zip

PKS2135-14

5GHz

Morganti et al. (1993)

PKS2135-14

Optical spectrum taken with ESO telescopes.

Tadhunter et al. (1993)

Spitzer 24um DataPKS2135-14_files/2135_14_24um.fits

PKS2135-14

Spitzer MIPS infrared photometric observations. Left to right: 24 microns, 70 microns and 160 microns (when available). FOV are 5x5 arcmins for 24 microns, 5x2.5 arcmins for 70 microns and 0.5x5 arcmins for 160 microns.

Dicken et al. (2008)

Next objectPKS2135-20.html
PreviousPKS2128-12.html
Wavelength/
Frequency       Flux      Units	                Reference                
5GHz	         1.38        Jy                        Morganti et al. (1993)
[OIII] λ5007     -12.99      Log erg/cm2/s      Tadhunter et al. (1993)
15GHz core       106.3      mJy                	Dicken et al. (2008)
22 GHz core      44.3        mJy	                 Dicken et al. (2008)
24 microns	104.9      mJy	                 Dicken et al. (2008)
70 microns	113.7      mJy	                 Dicken et al. (2008)
160 microns	118.6       mJy	                 Dicken et al. (2008)
X-ray            	-	        -	                 -http://adsabs.harvard.edu/abs/1993MNRAS.263.1023Mhttp://adsabs.harvard.edu/abs/1993MNRAS.263..999Thttp://adsabs.harvard.edu/abs/2008ApJ...678..712Dhttp://adsabs.harvard.edu/abs/2008ApJ...678..712Dhttp://adsabs.harvard.edu/abs/2008ApJ...678..712Dhttp://adsabs.harvard.edu/abs/2008ApJ...678..712Dhttp://adsabs.harvard.edu/abs/2008ApJ...678..712Dshapeimage_18_link_0shapeimage_18_link_1shapeimage_18_link_2shapeimage_18_link_3shapeimage_18_link_4shapeimage_18_link_5shapeimage_18_link_6

Other name:

Redshift:

RA (j2000):

Dec (j2000):

Optical class:

Radio Class:

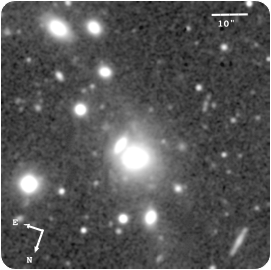
Gemini imagePKS2135-14_files/p2135_14.fits

0.200

21 37 45.18

-14 32 55.5

Q

FRII

OX-158

PKS2135-14

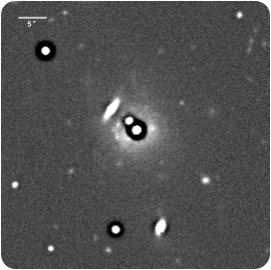
Gemini GMOS-S Unsharp mask image

Ramos Almeida et al. (2011a)


Gemini/GMOS-S: median filtered image

Notes

PKS2135-14

Spectral energy distribution.  The blue solid line is fitted to the data from 109 to 1010 Hz. Extrapolating this line from the radio to the infrared SED tests whether non-thermal synchrotron emission from the lobes can contaminate the Spitzer mid-infrared flux. In this case the lobes emission lies out of the Spitzer beam so cannot contaminate the Spitzer data.  The weak, flat spectrum, non-thermal radio core emission is also not likely to contaminate the Spitzer infrared flux data for this object.

Dicken et al. (2008)