


Flux data
Available Data Downloads
Images, Maps, Spectra and SEDs


Infrared data
Radio data
Optical data
X-Ray data


Spitzer IRS spectra
PKS2135-209
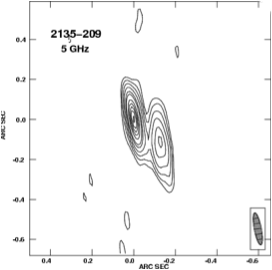
2135-209 at 4993 MHz from the MERLIN array. The peak level is 1.02 Jy/beam and contours are shown at -0.75, 0.75, 1.5, 3, 6, 12, 18, 35, 50, 65, 80, 95% of the peak.

PKS2135-209
Spitzer IRS spectra
Dicken et al. (in preperation)

PKS2135-209
Spitzer MIPS infrared photometric observations. Left to right: 24 microns, 70 microns and 160 microns (when available). FOV are 5x5 arcmins for 24 microns, 5x2.5 arcmins for 70 microns and 0.5x5 arcmins for 160 microns.


![Wavelength/
Frequency Flux Units Reference
5GHz 1.53 Jy Morganti et al. (1993)
[OIII] λ5007 -14.10 Log erg/cm2/s Tadhunter et al. (1993)
15GHz core - mJy Dicken et al. (2008)
22 GHz core - mJy Dicken et al. (2008)
24 microns 4.9 mJy Dicken et al. (2008)
70 microns 42.2 mJy Dicken et al. (2008)
160 microns 127.1 mJy Dicken et al. (2008)
X-ray - - -](PKS2135-20_files/shapeimage_18.png)


Other name:
Redshift:
RA (j2000):
Dec (j2000):
Optical class:
Radio Class:

0.635
21 37 50.00
-20 42 31.7
BLRG
CSS
OX-258

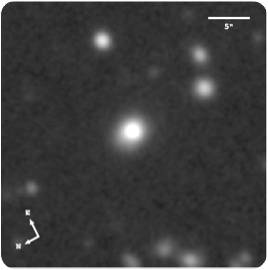
Gemini/GMOS-S: median filtered image
XMM
Notes
Shaw et al. (1995) have reported the detection of both broad MgIIλ2800 and higher order Balmer lines in absorption in this CSS (D∼3kpc) radio galaxy. Thus, showing clear evidence for both a quasar nucleus and young stellar populations in its optical spectrum (Tadhunter et al. 2002; Holt et al. 2007), PKS2135-20 can be classified as a post-starburst quasar (see Brotherton et al. 1999). The deep i′ image presented in Ramos Almeida et al. (2010a) shows that it lies in a relatively isolated environment, and that its host galaxy has a distorted outer envelope. Due to the presence of the strong quasar emission in the optical spectrum of this object, it is not possible to determine the age of its YSP accurately: both young (<0.1 Gyr) and intermediate (0.1–0.6 Gyr) ages are consistent with detailed fits to the continuum SED and higher order Balmer absorption features.
Close examination of the optical image shows a broad fan on the northern side of the radio galaxy of surface brightness μ_V = 23.5 mag arcsec^−2. This feature is very likely the result of a past galaxy interaction, consistent with the detection of a YSP in the nuclear region of this galaxy from optical spectroscopy (Holt et al. 2007), a FIR excess (Dicken et al. 2009), its relatively cool MFIR colours (Dicken et al. 2009), and strong PAH features (Dicken et al. 2011). The results regarding the continuum or line-emitting nature of this fan are inconclusive based on our long-slit spectra. Note that PKS 2135−20 is one of the only two galaxies (the other is PKS 2314+03) in our z < 0.7 sub-sample that would be classified as a ULIRG based on its MIFIR luminosity.
Details of the kinematics and ionization of the emission line gas in this source are discussed in Holt et al. (2008, MNRAS, 387, 639) and Holt et al. (2009, MNRAS, 400, 589) respectively.
PKS2135-209
Spectral energy distribution. The blue solid line is fitted to the data from 109 to 1010 Hz. Extrapolating this line from the radio to the infrared SED tests whether non-thermal synchrotron emission from the lobes can contaminate the Spitzer mid-infrared flux. In this case the lobes emission lies out of the Spitzer beam so cannot contaminate the Spitzer data. The weak, flat spectrum, non-thermal radio core emission is also not likely to contaminate the Spitzer infrared flux data for this object.