


Flux data
Available Data Downloads
Images, Maps, Spectra and SEDs


Infrared data
Radio data
Optical data
X-Ray data


Spitzer IRS spectra

PKS2250-41
Spitzer IRS spectra
Dicken et al. (in preperation)

PKS250-41
Spitzer MIPS infrared photometric observations. Left to right: 24 microns, 70 microns and 160 microns (when available). FOV are 5x5 arcmins for 24 microns, 5x2.5 arcmins for 70 microns and 0.5x5 arcmins for 160 microns.


![Wavelength/
Frequency Flux Units Reference
5GHz 1.27 Jy Morganti et al. (1993)
[OIII] λ5007 -13.80 Log erg/cm2/s Tadhunter et al. (1993)
15GHz core <1.9 mJy Dicken et al. (2008)
22 GHz core <1.1 mJy Dicken et al. (2008)
24 microns 11.6 mJy Dicken et al. (2008)
70 microns 22.0 mJy Dicken et al. (2008)
160 microns <27.6 mJy Dicken et al. (2008)
X-ray - - -](PKS2250-41_files/shapeimage_18.png)


Other name:
Redshift:
RA (j2000):
Dec (j2000):
Optical class:
Radio Class:

0.310
22 53 03.16
-40 57 46.2
NLRG
FRII
-

N

E


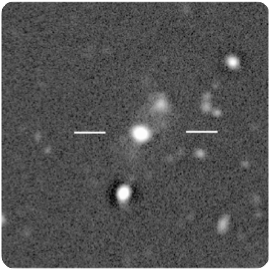
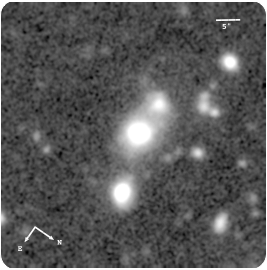
Gemini/GMOS-S: median filtered image
XMM
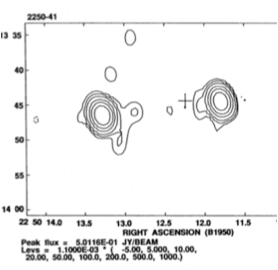
ATCA 5GHz
Notes
This NLRG/FRII shows a bright emission line arc that appears to enshroud the radio lobe to the west of the nucleus of the galaxy (Tadhunter et al. 1994). Spectroscopic studies of the ionization state and emission line kinematics of this arc provide some of the best evidence that the extended emission line gas along the radio axes of some radio galaxies is shock ionized (Clark et al. 1997, Villar-Martin et al. 1998).
The continuum properties of PKS2250-41 have been discussed in detail by Shaw et al. (1995) and Dickson et al. (1995). Its optical spectrum shows only narrow emission lines, but it is significantly polarized in the UV with the polarization E-vector close to the perpendicular to the UV structural axis. The relatively high intrinsic polarization suggests that scattered AGN light makes a substantial contribution to the UV excess in the nuclear regions.
Inskip et al. (2008) present the results of a multi-wavelength study of PKS2250−41, in which integral field and long-slit spectroscopy obtained using VIMOS and FORS1 on the VLT, and archival Hubble Space Telescope optical imaging observations are used to study the morphology, kinematics and ionization state of the extended emission-line region (EELR) surrounding this source, and also a companion galaxy at a similar redshift. Near-infrared imaging observations obtained using the New Technology Telescope are also used to analyse the underlying galaxy morphologies. The EELR displays a complex variety of different gas kinematics and ionization states, consistent with a mixture of radio source shocks and AGN photoionization.
The radio galaxy is likely to lie within a group environment, and is plausibly undergoing interactions with one or more other objects. The disc-like galaxy 47kpc to the northeast of the nucleus lies at a similar redshift to the radio galaxy itself, and has its major axis position angle aligned with the filamentary continuum and line emission extending outwards from the radio galaxy (Inskip et al. 2008). This filamentary structure is most plausibly interpreted as a tidal structure associated with an interaction involving the radio source host galaxy and the aligned companion galaxy to the north-east; this encounter may have potentially triggered the current epoch of radio source activity. Our emission-line-free i′-band GMOS-S image reveals a faint bridge linking the PKS2250-41 host with this NE companion, and a shorter one linking the radio galaxy with the smaller galaxy at 27 kpc towards the SW (Ramos Almeida et al. 2011a). Finally, it is possible to distinguish a faint arc-like tail extending to the west from the small galaxy companion and a fan towards the east of the radio galaxy. Overall, PKS2250−41 displays some of the best evidence that radio source activity can be triggered in galaxy encounters in groups of galaxies.
5 GHz ATCA radio map
PKS2250-41
Spectral energy distribution. The blue solid line is fitted to the data from 109 to 1010 Hz. Extrapolating this line from the radio to the infrared SED tests whether non-thermal synchrotron emission from the lobes can contaminate the Spitzer mid-infrared flux. In this case the lobes emission lies out of the Spitzer beam so cannot contaminate the Spitzer data. The weak, flat spectrum, non-thermal radio core emission is also not likely to contaminate the Spitzer infrared flux data for this object.